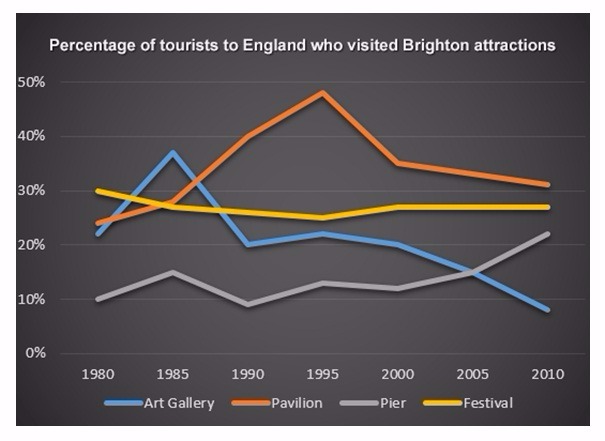
The percentage of England Visitors who visited four different attractions in Brighton between 1980 and 2010 is illustrated by the line graph. It is noticeable that, despite some fluctuations, Pavilion and Festival were the most visited place by tourists while art gallery and Pier stayed in the bottom in the all frame time.
Turning first to Pavilion and Festival, they began the rate stood at around 22% and 30% respectively. The number of tourists who visited Pavilion grew slightly to nearly 28% in 1985 whereas festival saw a first decline to similar level. Although, there was a gradual fall in Festival visitors between 1985 and 1995 to 25%, when people who visited Pavilion peaked at almost two fold.
On the other hands, the percentage of Art Gallery and Festival visitors, witnessed a dramatic rise and a slight dip respectively in 1985. The Art Gallery saw a significant fall to 20% in 1990, then continued to incline slightly in the following year, which led to a gradual fall in the end of the period. However, the number on Festival saw a slight drop in 1995, and relative stable to 2010.

AvjbsYEI4t0tJpcLJAz7.jpg
