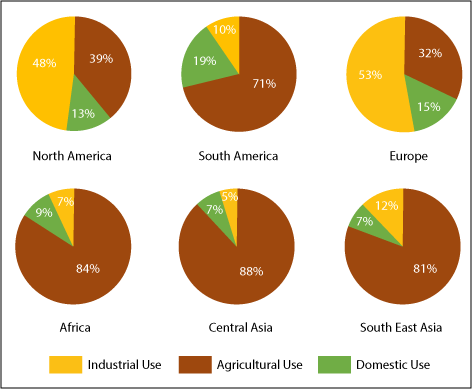
The charts below show the percentage of water used for different purposes in six areas of the world.
Summarise the information by selecting and reporting the main features, and make comparisons where relevant.
You should write at least 150 words.
The pie charts provide information about the proportion of water consumption for three different aims in some parts of the world.
A closer look at the data reveals that industrialization occurred in Europe has resulted in more than half of the water there is consumed for this category. Following this, North America consumes 48% water for its industry, while Central Asia uses only 5%, which is tenfold lower than North America, for the same purpose.
Turning to agricultural uses, the pattern is extremely different with the previous category. Some regions such as Central Asia, Africa, and South East Asia have a fairly similar pattern with water used for agriculture is 88%, 84% and 81% respectively. However, North America and Europe considered less consuming water for this category than other regions with just around one-third of the whole consumption.
Compared to other purposes, domestic usage accounted for a small proportion in all areas. It is interesting to note that Africa, Central Asia, and South East Asia consume water with the same amount (7%) whereas other areas use roughly double of that amount, with South America become the part of the world using the biggest proportion of water for this type of use.
To sum up, it can be seen vividly that the primary water consumption in North America and Europe is for industrial purposes whilst other regions, agriculture dominated water usage.

percentageofwater.png
