Statistical description based upon the graph and chart
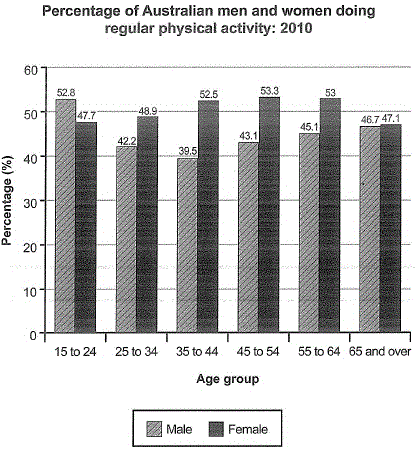
The bar chart below shows the percentage of Australian men and women in different age groups who did regular physical activity in 2010.
The presented bar chart compares between Australian men and women in terms of their regular physical activity in 2010.the data was segmented into six age groups.
Overall, it is clear that the percentage of women doing physical activities is mostly higher than the percentage of men in all ages groups except the one from 15 to 24 in which men outperform women with 5%.
The proportion of women doing physical activities in age from 35 to 46 is nearly steady at 53% while those in ages of 15 to 24 and 65 and over almost shared the same percentage 47%.
Men in ages brackets between 15 to 24 registered the higher percentage at almost 53% in performing physical activities. While men in the ages from 35 to 44 had the lowest proportion at\ 39.5%. men and women aged from 65 and over had a similar percentage in performing regular physical activities which is nearly 47%.
Words(155)

Bk12T5Barchart.g.gif
