Unanswered [1] | Urgent [0]
  

Home / Writing Feedback   % width   Posts: 4


IELTS Writing task 1 - Pie chart about population rate


thaolinh 5 / 10  
Feb 4, 2020   #1

Yemen and Italy


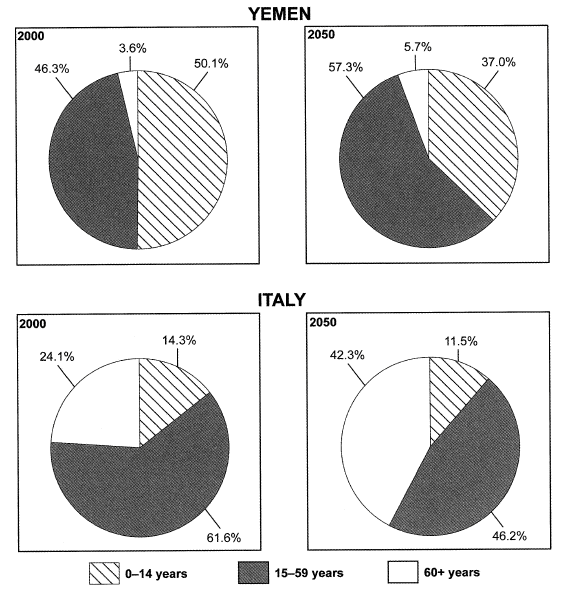
The charts below give information on the ages of the populations of Yemen and Italy in 2000 and projections for 2050.
Summarise the information by selecting and reporting the main features, and make comparisons where relevant.


The four pie charts compare the proportion of three age group between two countries Yemen and Italy in the year 2000 and show the forecast in both countries 50 years later. In general, Yemen and Italy have a large number of people in the middle age and they were predicted to undergo a significant change.

It can easily seen from the graph that, in 2000, Yemen and Italy witnessed the golden population rate, because they both had high percentage of people in the working age group ( the 15-59 years group), with nearly a half for the former and up to 61.1 % for the latter. Considering to the number of the elderly group, Italy number was far higher than Yemen's. While the figure for Italy was almost a quarter, 24.1%, that of Yemen just reached 3.6%. The youngest group, age group from 0 to 14 years old, was the group that accounted for the largest proportion in Yemen, over a half when there was 14.3% of the Italian in that age group.

The 2 other pie chart provide the prediction on the rate of age group of two countries 50 years later. Yemen middle age group' rate was expected to rise dramatically, from 46.3 % in 2000 to 57.3 % in 2050.In contrast, Italy number was forecasted to decrease by 15.4%, to 46.2% in the year of 2050. The elderly group of Yemen was projected to continue to remain in the lowest rate of the country, 5.7%, while Italy number will have increased quickly to just above two fifth. In 2050, it was predicted that the working age group will become the biggest group in Yemen, with the projected number is 57.3%. Middle age group figure was also projected to account for the largest proportion in the Italian population, up to 46.2 %.

-------------
Thank you for comment on my essay

  • detask1cam9test3..png


Samathan 1 / 2  
Feb 5, 2020   #2
Well, first of all, I think you need to reduce the length of your essay as the point in Task 1 just about one third of the point in full Writing test. You should write to the maximum of 250 words or you don't have time in Task II. Second, I really like the way you express your ideas and make comparisons between two countries, not just listing the data. However, you should use more language of fractions and percentages and decrease the data (I think it is too much) . (two fifth -> two fifths)
Holt  Educational Consultant - / 15385  
Feb 5, 2020   #3
When you have an image that refers to specific dates, you must mention the specific dates even if you change the presentation by saying "50 years later." It should be " 50 years later, in the year 2050" That is because Task 1 is all about being presenting the specific information from the report. Fractions, assumptions, creative descriptions, these are all acceptable in the essay, provided the specifics are not neglected and continue to be specifically presented in the report. That is what the TA criteria expects the writer to present and that is what is what should be included int he report. In fact, you can forgo the creative and flowery language in exchange for specifics, which will show a better understanding of the given information in relation to the report requirement.

Your trending statement is incomplete as it should show that the trend is based on the comparison of growth between the two countries over the same period of time, not just the development of one country.The trend for both countries must be presented in the report as it is in the chart.

Focus on providing mo more than 200 words for this essay. You will run out of time to proof read your work before submission. You will also cut into the allotted time for the task 2 essay. This is the reason why I said you should avoid the flowery presentation and just be factual in your report. Keep it short but informative, precise but not exaggerated. No more than 200 words will be required for the complete discussion of this task. In this case, you over discussed your presentation.
OP thaolinh 5 / 10  
Feb 5, 2020   #4
@Samathan
thank you Samathan


Home / Writing Feedback / IELTS Writing task 1 - Pie chart about population rate
Do You Need
Academic Writing
or Editing Help?
Fill out one of these forms:

Graduate Writing / Editing:
GraduateWriter form ◳

Best Essay Service:
CustomPapers form ◳

Excellence in Editing:
Rose Editing ◳

AI-Paper Rewriting:
Robot Rewrite ◳

Academic AI Writer:
Custom AI Writer ◳