Revenue Sources and Expenditures
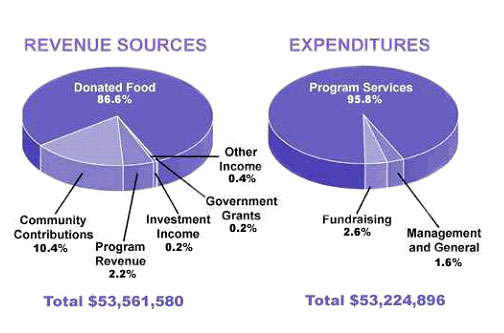
The pie chart shows the amount of money that a children's charity located in the USA spent and received in one year, 2016.
The pie charts illustrate the revenue sources and expenditure of a charitable organization for children in USA in the year 2016.
Overall, donated food made up the predominant part of revenue sources, while investment income and government grants were the smallest segments. In comparison, the bulk of money was spent on program services, whereas management and general contributed least to the expenditure.
In detail, donated food account for 86.6% of the total revenue source, while only just over one tenth of the revenue was from community contributions. Noticeably, government grants and investment income shared the same figure, which was 0.2%. Besides, program revenue and other income were 2.2% and 0.4% respectively. The total revenue was $53,561,580.
Furthermore, program services, which almost dominated the expenditure, tallied 95.8%. In stark contrast, only 2.6 of the spending was contributed by fundraising, and the figure for management and general was at 1.6%. The total spending was &53,224,896, which was approximately $340,000 higher than the total revenue.

xieltstask1piech.jpg
