Writing Task 1 - CAM 11 - Pie chart - Percentage of water used for different purposes
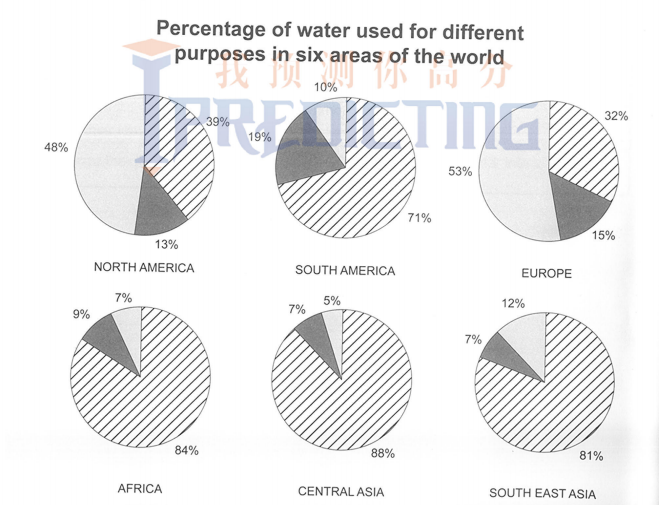
The pie chart illustrates the water consumption rate in categories of purpose by people in six wide territories all over the world. Overall, there is a significant difference between developed and developing regions in three main groups of using aim. The biggest portion of each kind is consumed in industry and agriculture respectively.
Given that, the water supplying in order to mobilize the industry in both North America and Europe dominates the rest, which obtains 48% and 53% all over the consumption proportionately. These two areas approximately halve their portions, one for industrial use, the other includes the sum of water utilized in agriculture and domestic use, considerably decreasing in quantity.
Opposing to the scenario in developed nations, agriculture virtually consumes almost the water in the developing countries. According to the descending order, people in Central Asia spend the biggest amount, standing at 88%, which is followed by Africa and South East Asia, hovering at 84% and 81% and lastly ended by the 71 percent-rate of South America. Turning to the domestic use, the percentage of this liquid just fluctuates around 8%, excepting 19% in South America region. The industry in these underprivileged countries absolutely contradicts those developed in favor of using water, which varies from 5% to 12%.
In general, privileged territories tend to prioritize water operation in industry much more than other developing areas, which have water consuming pattern in common.

Chart
