Unanswered [1] | Urgent [0]
  

Home / Writing Feedback   % width   Posts: 2


The pie charts illustrate the proportion of six categories of average household expenditures


Tiana 1 / -  
Jan 27, 2022   #1

IELTS writing task 1 pie charts


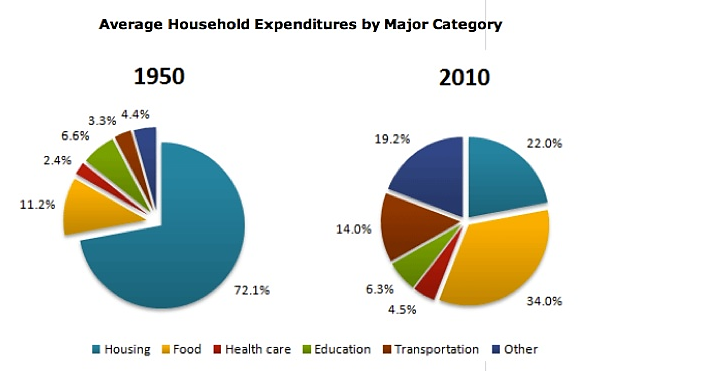
The pie charts illustrate the proportion of six categories of average household expenditures in 1950 and 2010.

Overall, the money spent on housing made up the majority of household expenditures in 1950 as opposed to food expenses in 2010. The percentage of health care expenditure was the least in both years. While the proportion for food, health care, transportation and other expenses increased, that for housing and education dropped during the period given.

Regarding the categories of expenditures that grew, the percentage of money spent on transportation in 2010 (14%) was over 4 times higher than that in 1950 (3.3%) compared to the figure for health care expenses which only doubled over the years (from 2.4% to 4.5%). Significant growth in expenditure could be seen in the food category, which had increased by 22.8% since 1950 and accounted for 34% of the average household expenditure in 2010.

On the other hand, the percentage of housing expenditure went down considerably, from almost three-fourths to around one-fifth of the total expenses, while the figure for education remained relatively stable, at around 6.5%.

  • 2 pie charts


Holt  Educational Consultant - / 15384  
Jan 27, 2022   #2
The pie charts

How many charts? How would you clearly differentiate the representations of each chart? How are these titled in the original presentation?

the proportion of six categories

Make the actual proportion measurement clear to the reader as this is clearly indicated in the actual image. Include a quick run-down of the 6 listed identifiers prior to its inclusion in the trending paragraph. The enumeration will allow the reader to quickly understand, remember, and consider the information coming from the trending paragraph.

The writer must consider using more sentences within the paragraph presentations. The requirement is for 3-5 comparative sentences, which do not represent run-on sentences. The simple and complex sentence presentations can use improvement. Avoid using only single or 2 sentence run-on presentations as presented in this report.


Home / Writing Feedback / The pie charts illustrate the proportion of six categories of average household expenditures
Do You Need
Academic Writing
or Editing Help?
Fill out one of these forms:

Graduate Writing / Editing:
GraduateWriter form ◳

Best Essay Service:
CustomPapers form ◳

Excellence in Editing:
Rose Editing ◳

AI-Paper Rewriting:
Robot Rewrite ◳

Academic AI Writer:
Custom AI Writer ◳