The writing of IELTS Cambridge 11 Test1 Task 1
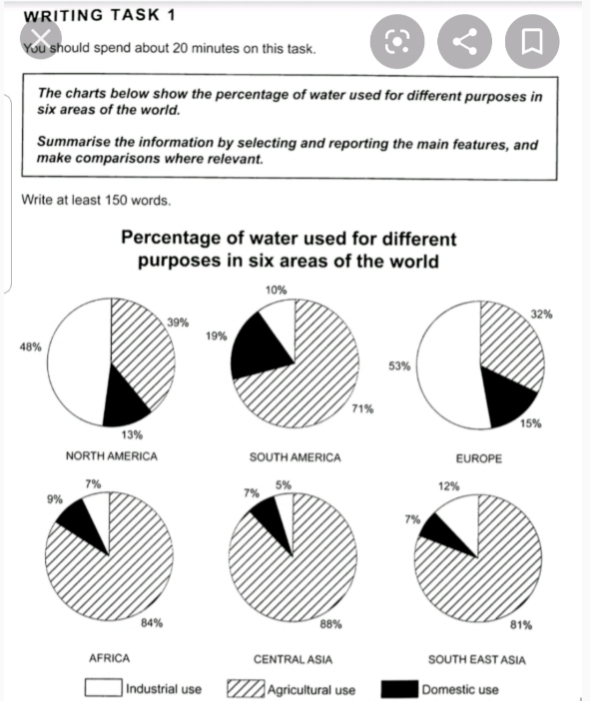
The pie charts illustrate the water usage for six different regions around the world. It is crystal clear to see that argriculture water using purpose occupied the greatest amount in Central Asia, and it is also the most biggest percentage among the three water categories. Next followed by industrial water usage,which contains about 53% in Europe. Compared to the others, the motive of taking domestic water is relatively less,only South America has 19% and demands more domestic water usage than the other five territories.
As we can see that although Central Asia consumed the most ratio of agriculture water purpose, its industrial one is the last. Taking a close look, we can easily to find out that its domestic one is in the last position as well, just 7%, same as South East Asia.
Then it is quite straightforward to know that Europe and north America are industrialized cause they need a lot of water for industrial purpose. On the other hand, the other four regions are non-industralized due to the extremely less portion of industrial water using purpose compared to the former one.

20190831_173347.jpg
