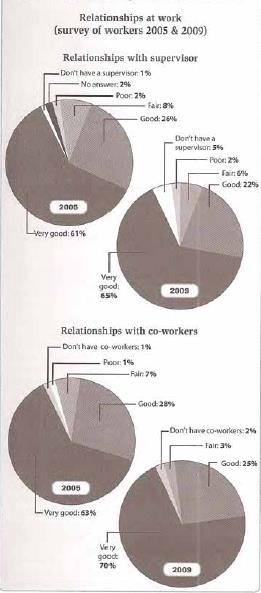
The pie charts reveal about the outcome of study which is conducted in 2005 and 2009 by interviewing the employees about their relationship with supervisor and partner job and it is measured by percentage. Overall, it can be seen that the pattern of both data were upward trend. In other word, the highest portion was relation with co-workers in 2009 and the lowest was relationship with supervisor in 2005, at very good category.
According to the data, in 2005, workers response of relation with supervisor in very good aspect was slight over half at 61 percent and in the next year this aspect hit point at 65 % in 2009. Interestingly, in 2005 workers who have supervisor only 1 percent however in 2009 it was slight increased by 4 % from 1 percent.
On the other hand, in the relationship with co-workers the majority sample said very good dominate at 63 percent and this aspect increased slightly at 70 % in 2009. In addition, in don't have co-workers and poor items had similar portion at 1 percent in 2005, but in the next period they vanish from list.

15357058_12030000103.jpg
