ainirere /
Apr 10, 2016 #1
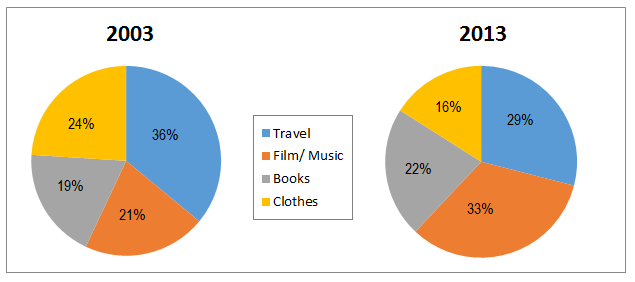
The pie charts below show the online shopping sales for retail sectors in New Zealand in 2003 and 2013.
The pie charts depict the sales of online shopping in terms of retail in New Zealand for the year 2003 and 2013. It is noticeable that travel, film and music have cornered the online sales throughout the year while books are the least.
In 2003, 36% was the highest proportion that has spent for travel sector. Moreover, the other retail sectors had nearly same percentage where the second largest was 24% for selling clothes, then 21% for entertainment sector in this terms are music and film and the smallest online earning was 19% for selling books.
However in 2013, film and music has soared to dominate the online shopping sales at nearly half of proportion of other retail sectors. Herein, travel declined to the second highest percentage at 29%. Furthermore, the others were minorities in which books increased at 22% and clothing decreased as the least was only at 16%.

Academic_IELTS_Writi.png
