Unanswered [1]
  

Home / Writing Feedback   % width   Posts: 4


The pie graphs compare the proportion of average budget spent by household for 6 specific categories


Yunghsin 1 / -  
Sep 6, 2016   #1
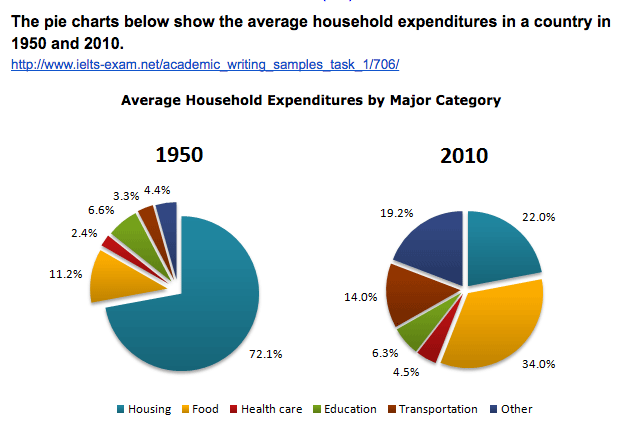
The pei graphs compare the proportion of 6 categories of spending by homes in a country between 1950 and 2010. It is clear that the majority number of expenditures by homes is 'housing' in 1995, while 'food' become the number one of household spending in 2010.

According to the figures, 72.1% of 'housing' is the most number of household expenditures in 1950, compared to dropped to 22.0%. Also, there was can be seen a small decline patterm which was 'education' - from 6.6% in 1950 to 6.3% in 2010.

However, completely different trends reveals other categories throughout the period shown. Apart from 'housing' and 'education', other portions all rose. 'Food' obvious substantially climbed from 11.2% in 1950 to 34.11% in 2010. 'Other' and 'transportation', at the same time, they both grew over 10%. The former increased from 4.4% in 1950 to 19.2% in 2010, while the latter rised from 3.3% in 1950 to 14.0% in 2010. Interestingly, 'Health care' showed a small growth just at 2.1%.

  • _20160906_11.0.png


Naoki28 10 / 15  
Sep 6, 2016   #2
Hi, Yunghsin.
Check the amendment below.

The pei pie graphs compare the proportion of ...
... while 'food' becomes the number one of ...

... 72.1% of 'housing' is was the most number of household ...
Also, there was can could be seen a small decline ...

However, completely different trends revealsed other categories ...
... while the latter rised rose from 3.3% in 1950 to 14.0% in 2010.
aidafitria18 9 / 13  
Sep 6, 2016   #3
I suggest you to use language changes for percentage:

- a very large majority for 75-85%
- a significant proportion for 65%-75%
- a minority for 10%-15%
- a very small number for 5%

overall, you have good language changes but you'd better improve your essay better than before. You should also pay attention subject-verb agreement and mispelling which is still found in your essay.

keep writing and spirit
justivy03 - / 2265  
Sep 7, 2016   #4
Hi Yung, no worries at all, I would love to review your final paper and I believe your revision will be a stronger essay that is ready for submission.

I also suggest that you follow the suggested remarks and modifications of your essay, this should be able to create a far better essay, well constructed sentences and an overall well managed essay.

Furthermore, most of the corrections made in your analysis is pretty minor, though however minor it is, it is still something that can be enhanced and with the help of contributors and your everyday practice, of course, I know you will be able to develop good writing skills that will equip you on your future writing projects.

I also suggest that you read a lot,reading English literature will definitely increase your vocabulary and this will help you come up or formulate a good sentence and ideas that will depict the thoughts you have in your head an d properly approach the prompt. This is one simple way you can develop your writing skills. Keep writing.


Home / Writing Feedback / The pie graphs compare the proportion of average budget spent by household for 6 specific categories
ⓘ Need Writing or Editing Help?
Fill out one of these forms for professional help:

Best Writing Service:
CustomPapers form ◳

Graduate Writing / Editing:
GraduateWriter form ◳

Excellence in Editing:
Rose Editing ◳

AI-Paper Rewriting:
Robot Rewrite ◳