Writing Task 1
The diagrams below give information on transport and car use in Edmonton.
Summarise the information by selecting and reporting the main features, and make comparisons where relevant.
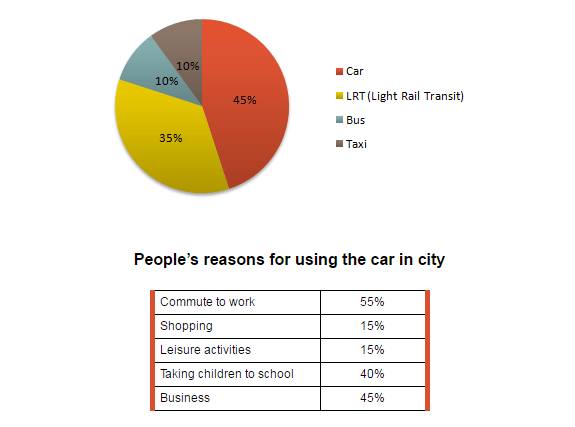
The pie chart shows the proportion of using four different transportations in Edmonton, and the table illustrates the reason why people utilize car in the urban area and is measured in the percentage. Overall it can be seen that most of the citizens utilize car as the main transportation for work and business purposes.
The most popular vehicle in Edmonton is the car, representing more than two fifths. Following this, the figure for Light Rail Transit (LRT) is 35% in the second highest percentage while the other conveyances are similar at 10% in both taxi and bus.
The more people use cars, the most it is helpful for a certain activity. At 55%, working is the primary objective for utilizing automobile. It decreases by 10 % for business. In the third place, there is two fifths of the total that use the cars for taking the toddler to school. Finally, going to shop and pastime activities are in the lowest number that experience a minority level at 15%.

People_car.jpg
