Writing task 1: Line graph analysis
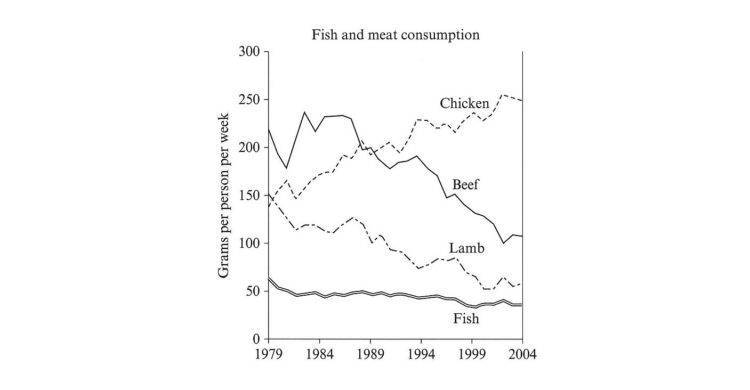
Question: The graph below shows the consumption of fish and some different kinds of meat in a European country between 1979 and 2004.
Solution:
The line chart shows the usage of fish and three kinds of meat including lamb, beef and chicken in a European country from 1979 to 2004.
Throughout the period shown, there was a downward trend of the consumption of beef, lamp and fish. By contrast, in that European country, people increased the consumption of chicken dramatically.
In 1979, fish was the most unpopular food in that given country, with only around 60 grams per person per week. In contrast, the amount of beef was the highest with approximately 220 grams per week, which compared to about 150 grams of lamb or chicken.
By the end of the period, in 2004, chicken became the most popular food at around 250 grams per week instead of beef which declined significantly at only about 100 grams per week. Besides, despite fluctuations over a period of 25 years, the usage of lamb fell by 50% from 150 to nearly 75 grams per week. However, this was higher than consumption of fish which dropped at only 40 grams per week.

ielts7test2task.jpg
