Please review my essay. Tks
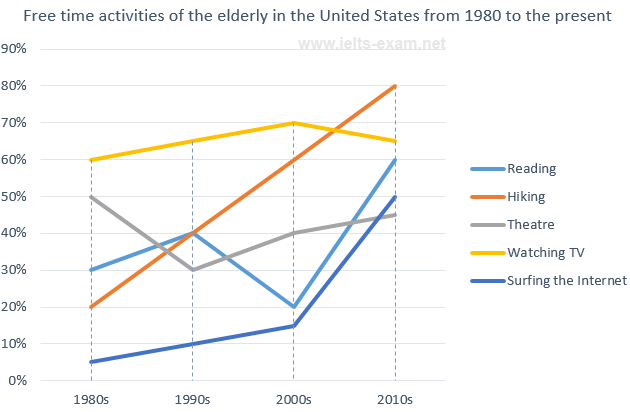
The line graph depicts how popular free time activities was that the US elderly took part in during the period of 1980 and 2010, namely reading, hiking, theatre, watching TV and Surfing the Internet.
Overall, the number of people joined in watching TV was the most, as an opposite pattern in that of surfing the Internet. In addition, there was an upward trend in proportion of watching TV, hiking and surfing the Internet. However, the figure for reading and theatre fluctuated significantly.
Looking at the details, in 1980, the percentage of watching TV was the most, at 60%, which was 40% more than hiking's, and was over 12 time as much as that of surfing the Internet. After that,the portion of watching TV reached a peak at 70% in 2000 before declining modestly in 2010. Nonetheless, time witnessed a sharp increase in how many people joined in hiking activity which overtook the number for watching TV and became a new dominant activity at the end of the period with over 80% being took up, which was followed by surfing the Internet, at 50% in 2010.
Nevertheless, there was a considerable decrease in the part of theatre, which then went up to over 45%. Finally, time registered a wild fluctuation in the figure for reading, which bottomed at 20% in 2000 before climbing steeply to 60% at the end of the examined course.
The line graph IELTS TASK 1
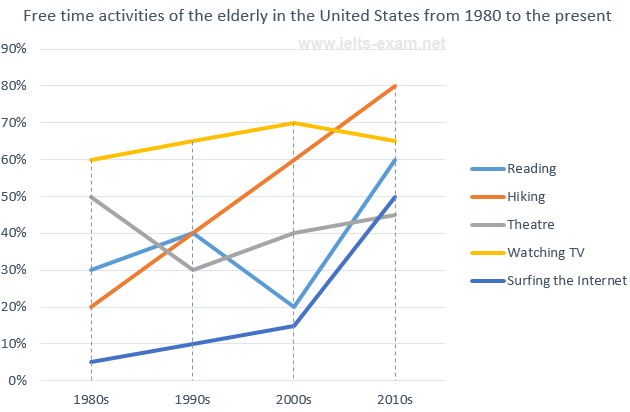
The line graph depicts how popular free time activities was that the US elderly took part in during the period of 1980 and 2010, namely reading, hiking, theatre, watching TV and Surfing the Internet.
Overall, the number of people joined in watching TV was the most, as an opposite pattern in that of surfing the Internet. In addition, there was an upward trend in proportion of watching TV, hiking and surfing the Internet. However, the figure for reading and theatre fluctuated significantly.
Looking at the details, in 1980, the percentage of watching TV was the most, at 60%, which was 40% more than hiking's, and was over 12 time as much as that of surfing the Internet. After that,the portion of watching TV reached a peak at 70% in 2000 before declining modestly in 2010. Nonetheless, time witnessed a sharp increase in how many people joined in hiking activity which overtook the number for watching TV and became a new dominant activity at the end of the period with over 80% being took up, which was followed by surfing the Internet, at 50% in 2010.
Nevertheless, there was a considerable decrease in the part of theatre, which then went up to over 45%. Finally, time registered a wild fluctuation in the figure for reading, which bottomed at 20% in 2000 before climbing steeply to 60% at the end of the examined course.

IELTS_Writing_Task_1.png
IELTS_Writing_Task_1.png
