Unanswered [1] | Urgent [0]
  

Home / Writing Feedback   % width   Posts: 3


IELTS Writing Task 1 - Population in Australia according to nationalities and living areas


potatowee 5 / 12  
Mar 4, 2020   #1

statistics of australian population


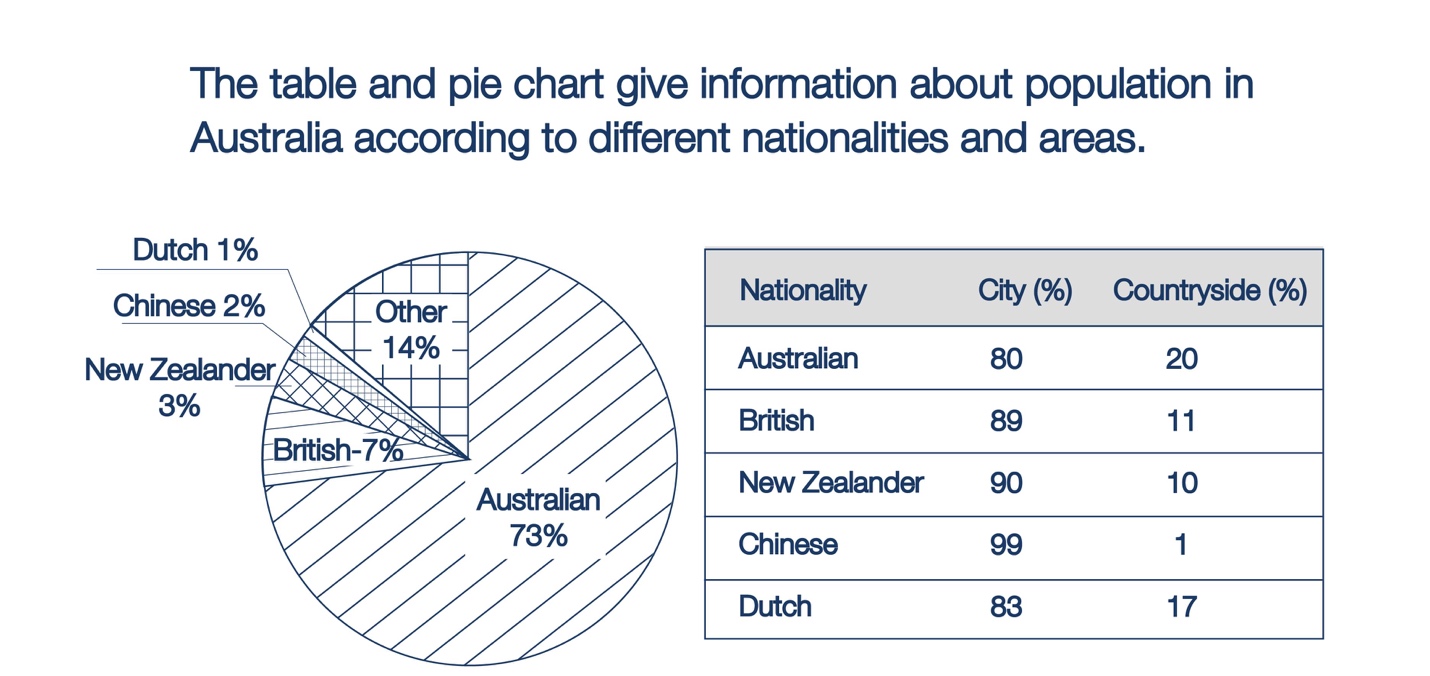
Prompt: The table and pie chart give information about population in Australia according to different nationalities and areas

My answer:
The table and pie chart illustrate the proportion of people living in Australia in terms of their origins and location. There are five main nationalities represented in the charts, namely Australian, British, New Zealander, Chinese and Dutch. It is clear that native Australian is responsible for the majority of the population in the country, however making up the least proportion of city dwellers (80%).

The population in Australia is composed of 73% native Australian, followed by which is British with 7%. New Zealander, Chinese and Dutch made up for 3%, 2% and 1% of the population respectively. The rest people living in Australia have an origin from other countries.

Even though Chinese made up less than Australian in terms of population, it stood out as the nationality with the highest percentage of city inhabitants (99%) and also the lowest percentage of people living in countryside area. The proportion of city dwellers from New Zealand is lower than China by 9%, which was higher than Britain by 1%. Conversely, countries such as Australia and Netherlands have a larger share of people accomodating in countryside areas, with 20% and 17% respectively.

  • Task1.jpg


Holt  Educational Consultant - / 15385  
Mar 4, 2020   #2
When you write a report based on 2 different charts, make sure that you identify which type of chart you are presenting information for in the presentation. Remember, the assumption here is that the examiner will not have a copy of the image to base your report in. Without your identification of the type of image you are discussing, the examiner will tend to get confused and be unable to reconcile the data with the correct image. This will affect your TA plus C&C score.

As you write the summary overview, remember that you are supposed to present a trending statement that does not yet include any information from the chart. The trending statement talks about highs and lows while keeping the actual information for the body of the essay. The summary overview in the Task 1 test is equivalent to the prompt restatement in Task 2. Both sections do not require actual data presentation immediately. By the way, don't present information in a parenthesis. It is always part of the actual discussion, never an optional discussion.

Remember that each sentence needs to clearly represent information from the image. Your second paragraph is lacking in the 3 sentence requirement to meet the minimum standards for a paragraph. You should make sure to divide the information into individual sentences so as to meet the sentence requirement per paragraph and also, allow you the opportunity to clearly explain your data interpretation.
HoangThuyAn 2 / 3  
Mar 9, 2020   #3
... lower than China by at 9%, ... Britain by at 1%


Home / Writing Feedback / IELTS Writing Task 1 - Population in Australia according to nationalities and living areas
Need Writing or Editing Help?
Fill out one of these forms:

Graduate Writing / Editing:
GraduateWriter form ◳

Best Essay Service:
CustomPapers form ◳

Excellence in Editing:
Rose Editing ◳

AI-Paper Rewriting:
Robot Rewrite ◳

Academic AI Writer:
Custom AI Writer ◳