Hello, please give me some advice and help me with improving my writing skills, thanks a lot!!
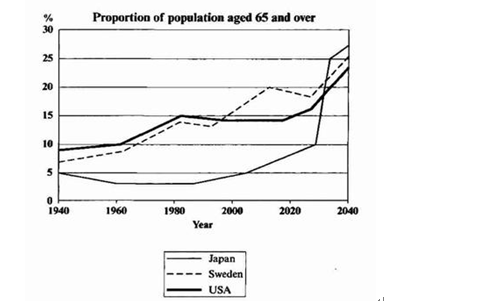
The line chart below shows the percentage of population aged under 5 years old and aged 65 years old or above in the world since 1940 with projections until 2040.
ESSAY
The given line chart illustrates the increasing population aged 65 years old or above and aged under 5 years old in three countries between 1940 and 2040.
Generally, the population of the USA, Sweden, and Japan all boost from 5-10% in 1940 to 20-30% in 2040. We can see a significant change in the ranking for the percentage of these three countries.
As observed, the USA is in the first place of the population of children and elderlies at the percentage around 10% while Sweden and Japan ran the next two place in roughly 7% and 5%. On contrary, there's a large change of population in 2040 with the highest percentage of the population which is approximately 27% in Japan. The percentage in the USA turns out to be the least at about 23%, and the population in Sweden is slightly higher at 25%.
Obviously, these three countries have different increasing extent from 1940-2040. There was little variation of the population between 0-5% from 1940 to 2000 in Japan and meets a huge boost at 2030 respectively. For the USA, the percentage remains from 1980 to 2020 at 15%, then increases gradually in the next two decades until 2040. Apart from the other two countries, Sweden has a stable extension of the population as a step-growth from 1940 to 2040.
Fast aging population
The line chart below shows the percentage of population aged under 5 years old and aged 65 years old or above in the world since 1940 with projections until 2040.
ESSAY
The given line chart illustrates the increasing population aged 65 years old or above and aged under 5 years old in three countries between 1940 and 2040.
Generally, the population of the USA, Sweden, and Japan all boost from 5-10% in 1940 to 20-30% in 2040. We can see a significant change in the ranking for the percentage of these three countries.
As observed, the USA is in the first place of the population of children and elderlies at the percentage around 10% while Sweden and Japan ran the next two place in roughly 7% and 5%. On contrary, there's a large change of population in 2040 with the highest percentage of the population which is approximately 27% in Japan. The percentage in the USA turns out to be the least at about 23%, and the population in Sweden is slightly higher at 25%.
Obviously, these three countries have different increasing extent from 1940-2040. There was little variation of the population between 0-5% from 1940 to 2000 in Japan and meets a huge boost at 2030 respectively. For the USA, the percentage remains from 1980 to 2020 at 15%, then increases gradually in the next two decades until 2040. Apart from the other two countries, Sweden has a stable extension of the population as a step-growth from 1940 to 2040.

d4oSylvb3tt4RDMROHiE.png
