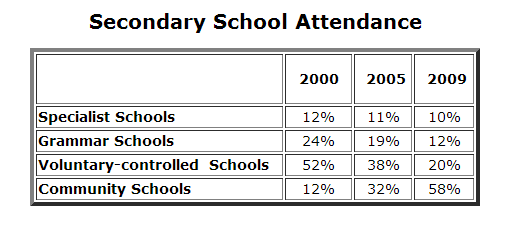
A table gives information about the presence of pupils which school in Secondary School over the following different three years in four different school types, such as specialist schools, grammar schools, voluntary-controlled schools, and community schools. It is important to note that an gradual growth in three years and the highest rise in the last period was community schools.
In the beginning, community schools experienced a few rate at 12% in 2000, the same inception with specialist schools, but then specialist schools indicated steady reduction to the lowest level. Community schools saw an enormous rise of 32% in 2005, afterwards it found the highest percentage in 2009 at 58%.
The second highest grade was obtained by voluntary-controlled school at 52% in 2000. However, different with community school, it showed significant drop at 38% in 2005 and 20% in 2009.

Graph_8.png
