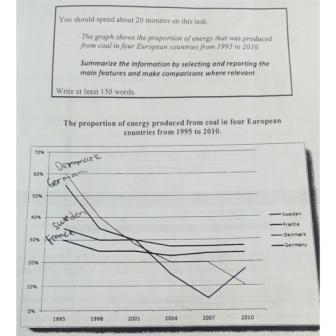
The graph gives information about the percentage of energy produced from coal in four countries, including Denmark, Germany, Sweden, and France, over 15-year period. The main fact that stands out is that the production of energy from coal in all countries experienced a decrease over the period shown.
Denmark and Germany began at fairly similar levels of 60% and 55% respectively in the proportion of energy from coal. Subsequently, both Denmark and Germany jumped sharply to under 20%, when Germany hit a low of 5%. However, there was a slight increase for Germany, in which German overtook Denmark to finish around 18%, while Denmark finished at 10%, the lowest of that year.
On the other hand, the energy from coal which was produced in Sweden and France stood under 40%, and then fell slightly to same or under 30% in 1998. Over the following three years, their proportion remained stable, which were followed by a short fall in 2004 and leveling off at this rate for the remainder of the period.

ielts_task_1.2.jpg
