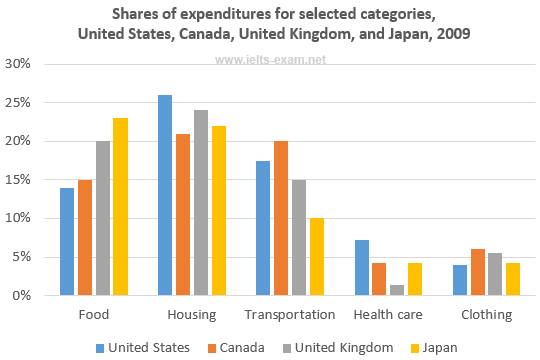
A breakdown of the information about the proportion of expenditures on five different needs in four developed countries in 2009 is shown in the bar chart. Overall, with the exception of Japan, all countries spent their money on housing.
According to the chart, United States of America had dominated proportion on housing and health care by 26% and 7% respectively. On the other hand, Canadian had the largest percentage on transportation and clothing at 20% and around 5% respectively. However, on food consumption, Japanese become the best proportion than other countries by 23%.
A more detailed look at the graph revealed that Japan had the least proportion on transportation expenditure by 10%. Americans spent the lowest percentage on food and clothing, which shown by almost 15% and below 5% respectively. Interestingly, both Japanese and Canadian had the same proportion on health care expenditure by almost 5%. Furthermore, United Kingdom had the least position on health care by 1% and this country was not predominated in other categories.

Bar_chart.jpg
