Unanswered [3] | Urgent [0]
  

Home / Writing Feedback   % width   Posts: 2


Task 1 - The proportion of families owning and renting houses in England and Wales (1918 - 2011)


halun1682 1 / -  
May 14, 2021   #1

the percentage of households in owned and rented accommodation


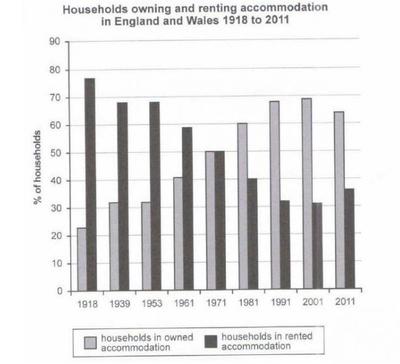
The chart below shows the percentage of households in owned and rented accommodation in England and Wales between 1918 and 2011.

The given chart illustrates the proportion of families owning and renting houses in England and Wales from 1918 to 2011.

Overall, the number of people living in their own house increases, except for the year 2011, while that of rented accommodations saw an opposite trend over the period.

In 1918, the figure for households in rented housing stood at 77%, which was three times as much as that of owned housing. In the following years, there was a steady rise in the percentage of people who prefer to own their own house, which was 50% in 1971. That figure was equivalent to that of rented households in 1917, after experiencing a gradual decline of 27%.

Over the next decade, the percentage of owned accommodations continued to reach a peak of almost 70% in 2001, which was followed by a moderate fall of 5% in 2011. Meanwhile, the figure for people who opt for renting a house plummeted to 31% in 2010 before witnessing a slight growth of 5% at the end of the period.

  • ieltsbarcharthous.jpg


Holt  Educational Consultant - / 15379  
May 15, 2021   #2
The given chart illustrates

Using what charting method? Linear? Bar ? Identify the typeof chart ownage provided. Ldon't just rely on the prompt for image identification.

house increases,

Time reference error. The measurement has been previously completed. It is not an ongoing action soit should not be using active present tense references.

1917

No such year is included in the chart. However, there is a reference to 1971. This is an inaccurate year reference which affects the validity of your summary report.

Errors in grammar and task accuracy exist in certain areas of your report. You failed to edit and proofread your data presentation. The errors remained uncorrected so, in the actual test, these would be one of the sources of scoring deductions in your sectional and final score.


Home / Writing Feedback / Task 1 - The proportion of families owning and renting houses in England and Wales (1918 - 2011)
Do You Need
Academic Writing
or Editing Help?
Fill out one of these forms:

Graduate Writing / Editing:
GraduateWriter form ◳

Best Essay Service:
CustomPapers form ◳

Excellence in Editing:
Rose Editing ◳

AI-Paper Rewriting:
Robot Rewrite ◳

Academic AI Writer:
Custom AI Writer ◳