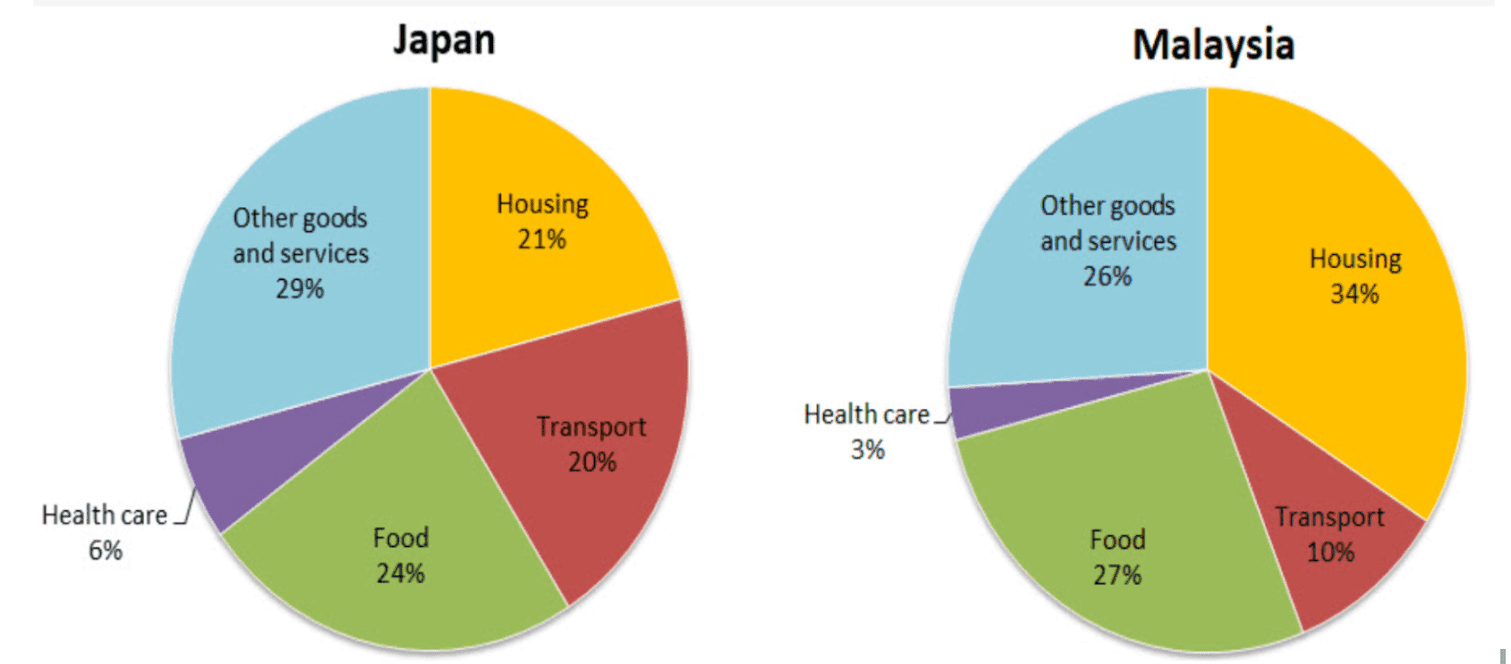
The pie charts below show the average household expenditures in Japan and Malaysia in the year 2010.
The pie charts compare the proportion of money spent on different goods and services of households between Japan and Malaysia in 2010. The data is calibrated in percentage.
Overall, both countries spent the highest amount of money on housing, food and other goods and services. It is also noticeable that the expenditure on healthcare and transport was the lowest in two nations.
To begin with, the amount of money spent on housing accounted for 34% in Malaysia, 13% greater than the figure for Japan. Regarding food, a small percentage of the expenditure which Japanese people allocated for this service compared to more than a quarter in Malaysia. The proportion of expenses on other foods and services in two countries was 29% and 26%, respectively.
In contrast, the expenditure spent on transport made up a fifth of the total expenditure in Japan, whereas the figure for Malaysia was 10%. Finally, 6% was the percentage of the amount of money spent on healthcare, twice as much as the average healthcare expenditure in Malaysia.

screenshot56min_.png
