Spendings in Asia in the pie charts
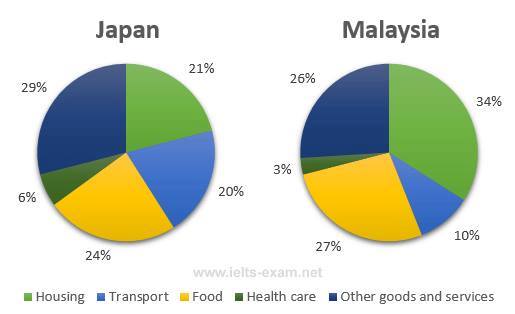
The pie charts present the proportion of primary need expenditures in Malaysia and Japan in 2010. Overall, it can be seen that the smallest percentage of spending money was health care in two countries.
Turning to a more detailed analysis, housing was the largest expenditure in Malaysia at 34% whereas this only accounted for more than a fifth in Japan, making it occupy the third rate. Interestingly, food came in the second place in both countries at 27% and 24% respectively. Meanwhile, other goods and services were in third position in Malaysia with percentage approximately 26%. The largest proportion witnessed in Japan and making it stand in the first rate with the percentage of about 29%.
Turning to another comparison, the lowest proportion of spending household in both countries was in transport and health care with each different percentage of primary need. However, a domination with more than double was seen in Japan.

15826394_13804818319.jpg
