Hi everyone, I wrote this paragraph for IELTS Writing Task 1. I really appreciate any help/comment!
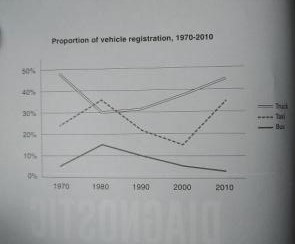
The graph below shoes changes in the share of vehicle registration of the three most common types of commercial vehicles in the US between 1970 and 2010.
----
Word Count: 150
----
The line graph reports the ratio of the means of transportation in the United States between 1970 and 2010. Overall, trucks occupied the majority of the transportation registration, followed by taxis, then buses. In 1970, almost 50% of the vehicle registered were trucks, while 25% were taxis, and buses took up above 5%. In 1980, however, taxis rose to the highest proportion since the number of trucks steeply declined; buses also had an increase and met its peak. From 1980 onwards, the number of trucks gradually increased, in contrast, were buses. Taxis had its trough in the year 2000 but soon rose strongly afterward. By 2010, compared to the starting points, taxis were the only mean of transportation that gained popularity in vehicle registration in the United States, while the other two both declined. In particular, the new proportions of trucks, taxis, and buses were 45%, 35%, and 3% respectively.

Vehicle.jpg
