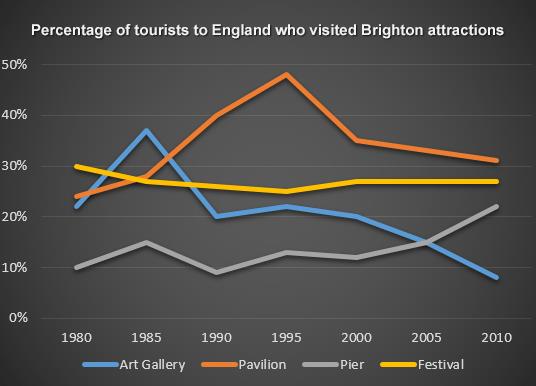
The line graph below shows the percentage of tourists to England who visited four different attractions in Brighton.
Summarize the information by selecting and reporting the main features, and make comparisons where relevant.
Write at least 150 words.
The line graph illustrates changes the number of travelers to England for visiting four different attractions in Brighton and is measured in percentage from 1980 to 2010. Overall, it can be seen that, despite some fluctuations, over the period as a whole the percentage of tourists decreased gradually in art gallery.
Pavilion and festival stood at a fairly similar level of between a quarter and less than a third in 1980, but while visitors of pavilion rose significantly over the following ten years, tourists of festival decreased steadily to around 25 % in 1995. However, they both then followed a similar trend, remaining stabled at 26 % (festival) and 31 % (pavilion).
Pier had a more erratic pattern of visitors than the other three attractions. In 1980, tourists of pier stood only at ten percent which was the lowest level than art gallery, pavilion or festival. Whereas art gallery rose significantly at 38 percent in 1985, tourists experienced a significant fall to 8 percent in the end of period.

line_graph.jpg
