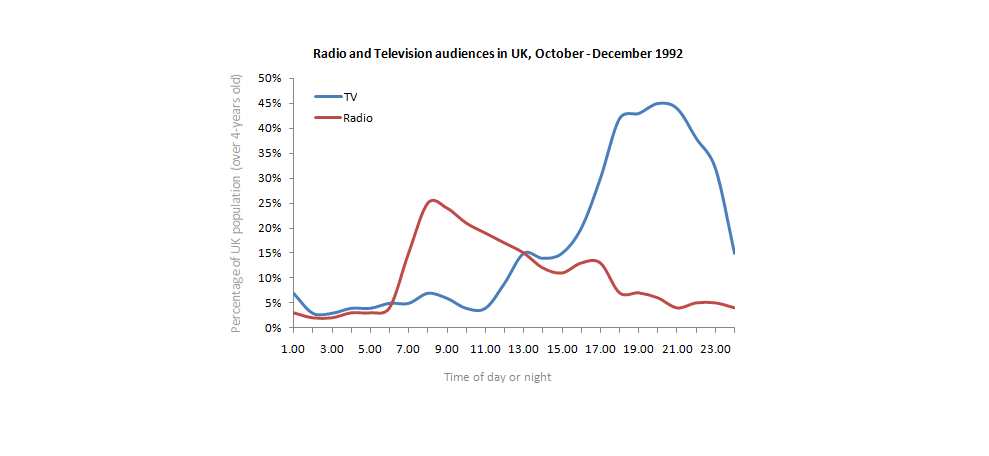
Write a report for a university lecturer describing the information shown below.
================================================================= ========================================
Answer:
The graph gives information about audience in UK who is interested toward radio and television throughout the day in 1992.
Generally, there are explained how percentage of UK population like radio and television from October- December 1992.
Firstly, in 1992, people in UK was interested hearing radio approximately 3 percentage of over 4-years old at 1 o'clock, and it climbed ever higher to almost 25 % at 8.00 o'clock. However, it began to fall to be just above 23 % at 9.00 o'clock which fell steadily until at 13.00 o'clock. Then, it began to fall sharply at 15.00 o'clock among 10 %, and this graph undergone fluctuating until middle night which many persons undergone decreasing sharply to hear radio.
Secondly, some people were interested watching television approximately 13 % at 1.00 o'clock, and it fell slightly at 2.00 o'clock. However, this data increased steadily until 8.00 o'clock that undergone fluctuation respective. Then, it increased sharply at 18.00 o'clock approximately 43 % that fell sharply at 23.00 o'clock.
To sum up, some people was more interested watching television than radio at 18.00 o'clock - 21.00 o'clock that undergone to fall sharply at the time.

Radio_and_TV_in_UK.p.png
