Unanswered [1] | Urgent [0]
  

Home / Writing Feedback   % width   Posts: 4


Rainfall in Johannesburg and Cape Town from January to December//IELTS TASK 1


newraki 1 / 1  
Dec 3, 2017   #1
Hello everyone.I started studying IELTS task 1 and this is my first writing.therefore I may be able to make mistakes.Please could you say where I made mistakes?

Rainfall in Johannesburg and Cape Town


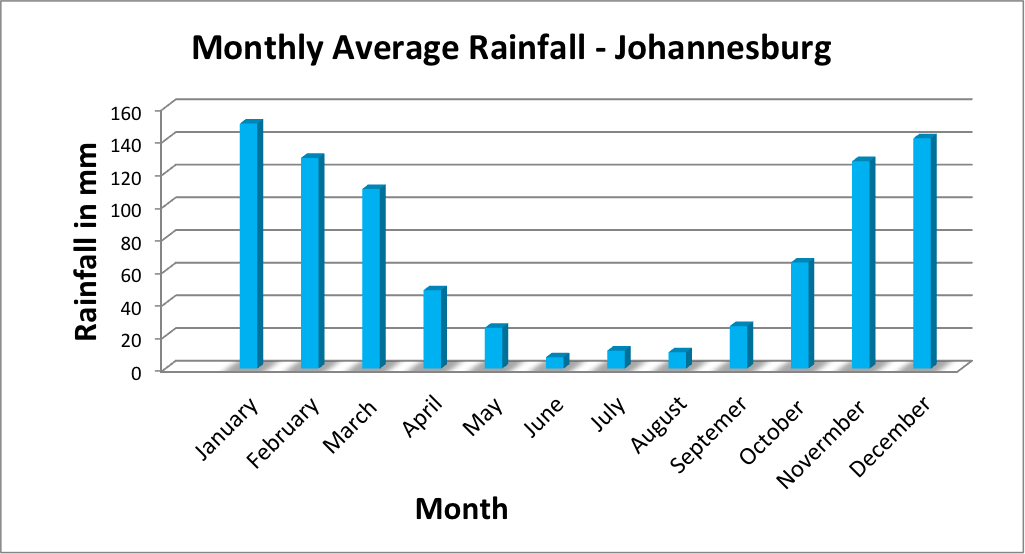
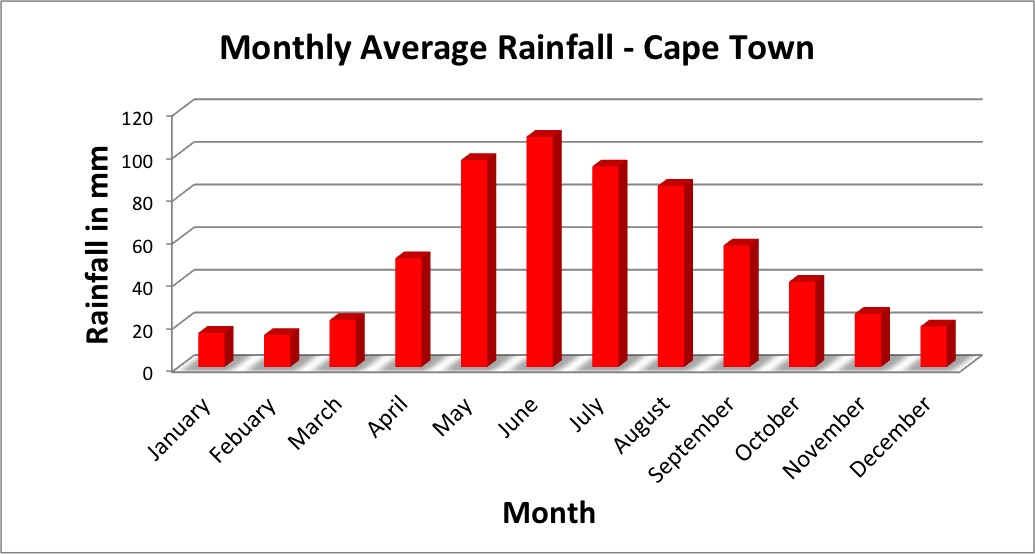
These two bar graphs show the annual rainfall in Johannesburg and Cape Town from january to December as indicated on the x-axis.The y-axis indicates the amount of rainfall from 0 to 120 millimeters in each month.

In January Johannesburg experiences rainfall about 150 millimeters of downfall.Similarly,Cape Town has almost 110 millimeters of rainfall in June.futhermore,Johannesburg has the least rainfall in June while Cape Town has the highest rainfall in the same month.Johannesburg has got more downfall from October to March than Cape Town.Nevertheless,Cape Town sees more downfall from April to September than Johannesburg.

As we can see from overall shape of these bar graphs,Johannesburg has got high rainfall from October to March and low rainfall from April to September.Opposite to this,Cape Town has got high rainfall from April to September and low rainfall from October to March.

  • Cope Town

  • Johannesburg


Holt  Educational Consultant - / 15385  
Dec 4, 2017   #2
Onur , from what I can tell, the most obvious problem in your presentation is your sentence count per paragraph. In most of the paragraphs, you only have 2 sentences when the requirement is anywhere from 3-5 sentences in order to meet the C&C complete paragraph requirements. You use a lot of run-on sentences through commas in your presentation which, detracts from the proper sentence structure and coherence of the paragraph. In the opening paragraph, you could have done it this way instead:

These two bar graphs show the annual rainfall in Johannesburg and Cape Town. The months indicated are from january to December. The information is indicated based on the x-axis.The y-axis indicates the amount of rainfall from 0 to 120 millimeters in each month.

Note that you have a capitalization error in the presentation as the month of January is a proper noun and should be capitalized. There is a sentence missing in this format. This paragraph would have been made stronger if you had presented your trending statement here instead of at the very end of the essay.

By the way, you need to use past tense in the presentation because you have already seen the graphs and are merely reporting on it now. Therefore, the rainfall measurements have already taken place. Additionally, the term is "rainfall" not "downfall". Watch out for your capitalization problem. The first word of every sentence must be capitalized. You forgot to do that (again). The second paragraph could have been better divided into sentence sections in order to create more complex structures and offer a more impressive sentence development and grammar range consideration. Unfortunately, I am not allowed to revise complete paragraphs in order to show you the mistakes and then give you the corrected version. I can only point it out to you and you can apply the changes yourself to your next practice test. I cannot come back to advice you on the same essay.

Your essay is running short in terms of paragraph presentations that will gain you a higher score. You need to aim for at least 4 complete paragraphs so that you will have a better opportunity to show off your grammar range, lexical resource, and coherence and cohesiveness skills. The combination of all 4 presented in one essay of 4 paragraphs can help you get higher, per criteria scores for an increased overall scoring result.
OP newraki 1 / 1  
Dec 5, 2017   #3
Thank you for your suggestions.In a new writing,I will try to remember your suggestion and I hope I would make less mistakes than this writing.
sbina 2 / 5  
Dec 6, 2017   #4
@newraki

another suggestion, I hope it will be useful

In the second paragraph it should be a body paragraph which contain and describe a spesific detail on the graph. I think that your discussion is not clear for a viewer. The paragraph do not require viewer's expectation to show the meaning. You shoul more detail to give an clearly image about the graph.

My suggestion, you should fing a TREND or a PATTERN which shows particular change.

help mine to review my essay. Good luck


Home / Writing Feedback / Rainfall in Johannesburg and Cape Town from January to December//IELTS TASK 1
Do You Need
Academic Writing
or Editing Help?
Fill out one of these forms:

Graduate Writing / Editing:
GraduateWriter form ◳

Best Essay Service:
CustomPapers form ◳

Excellence in Editing:
Rose Editing ◳

AI-Paper Rewriting:
Robot Rewrite ◳

Academic AI Writer:
Custom AI Writer ◳