Task 1 - a survey
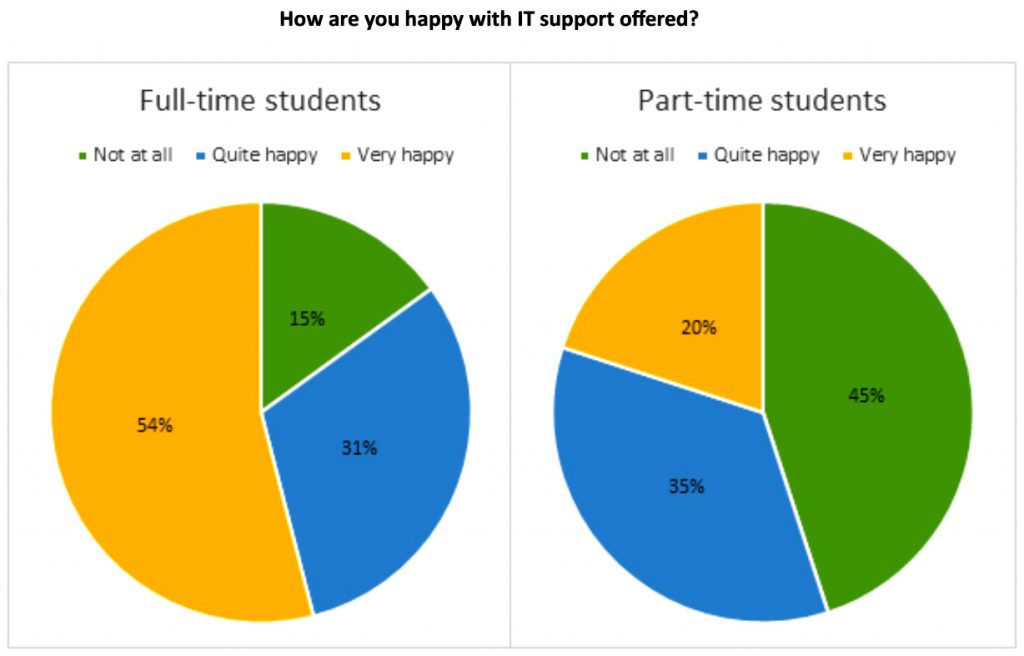
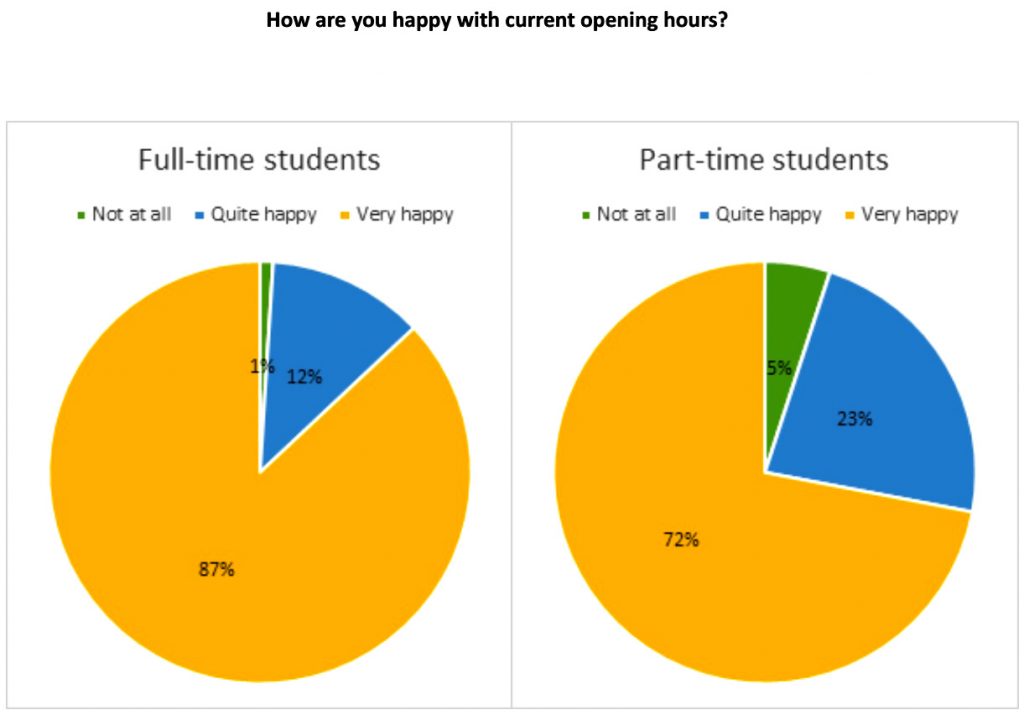
The pie charts show the results of a survey conducted by a university on the opinions of full-time and part-time students about its services
The two diagrams give information about the rate of students' pleasure of some supported-studying services in a university.
Overall, most students in that school rate very pleased with the two mentioned services, yet, only the support of technology was reported just roughly happy by students.
In terms of the supplement of electrical devices, more than a half of full-time students rates super impressed, while the figure for those who study part-time courses just account for 20%. For the average rates for just little happy, there are 45% of the part-time students, who are higher than the full-time ones by 30%. And for the unhappy rates, it was seen nearly similar amount in both students studying full-time and part-time class with 31% and 35% respectively.
Moving to the expansion of study hours, there are both considerable percentages in two groups of students, who are highly appreciate with this service, with 87% and 72% for full-time and part-time pupils one by one. However, the number of people who report little pleasure in full-time classes stands for just nearly 12%, which is fewer than studying part-time by 11%. The last dislikes this service, barely account for a tiny fraction.

IETLSWritingrecent.jpg
IETLSWritingrecent.jpg
