Graph analysis - number of smokers
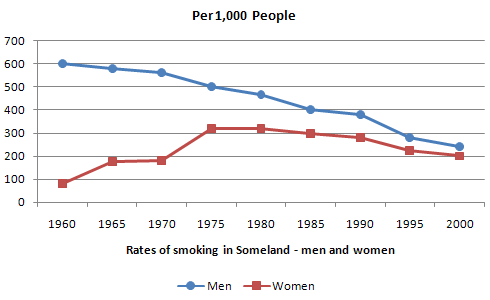
A glance at the graph provided reveals the smoking rates in men and women in Someland during the period from 1960 to 2000. It is evident that both genders saw considerable fluctuations in nicotine consumption.
Peaking at 600 in 1960, the rate of male smokers then sustainly decline of 500 in 1975. In 1985, the nicotine consumption still decreased and there were just 400 men in every 1,000 smoking. The latter half of century continued seeing the smoking rate in men slide away, nearly one third to the begining, somewhere in the vicinity of 200 in 2000.
The rate of female smokers, meanwhile, had a low start at only 100 prior to 1960, before rising exponentially to more than 300 in 1975. The following ten years saw a steady decline to 300 in 1985, followed by a gradual fall.
It is interesting to note that while the gap between smoking rates in men and women were widen at first, they then both decreased after the prior to 1975 although the number of female smokers increase as twice as its beginning.

