Hi guys, I've just started training my writing skill, hope you-all would give me some advice about my essay, thank you so much:
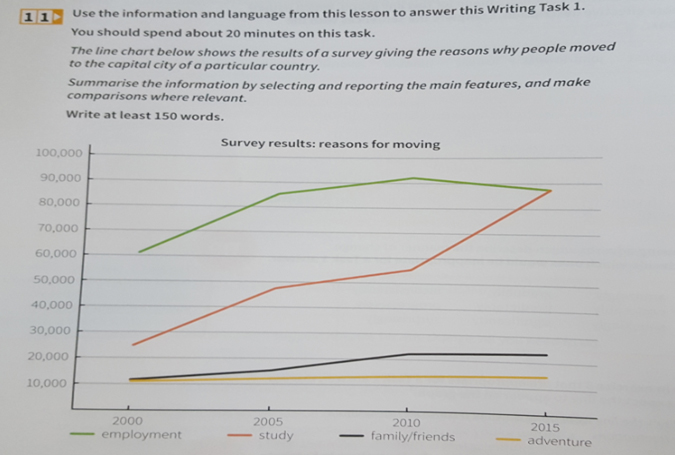
The given chart illustrates different reasons which made people move to the capital city of a particular country between 2000 and 2015. Overall, there was an increase in the number of people moving for employment, study, family/friends and adventure.
At the start of the period, employment was the most popular reason with about 60,000 people. Then, it climbed steadily and reached a peak at over 90,000 in 2010 before slightly falling to just below 90,000 people in 2015.
On the other hand, the number of people who went to the capital for study just started at about 25,000 in 2000. After that, the figure rose by about 65,000 over the given period.
In 2000, family/friends and adventure were the lowest figure shown on the chart, just around 10,000. Over the 15-year period, the figure for family/friends was moderately higher than the adventure in 2015, at just above 20,000 and nearly 15,000 respectively.
summarise the information from the chart
The given chart illustrates different reasons which made people move to the capital city of a particular country between 2000 and 2015. Overall, there was an increase in the number of people moving for employment, study, family/friends and adventure.
At the start of the period, employment was the most popular reason with about 60,000 people. Then, it climbed steadily and reached a peak at over 90,000 in 2010 before slightly falling to just below 90,000 people in 2015.
On the other hand, the number of people who went to the capital for study just started at about 25,000 in 2000. After that, the figure rose by about 65,000 over the given period.
In 2000, family/friends and adventure were the lowest figure shown on the chart, just around 10,000. Over the 15-year period, the figure for family/friends was moderately higher than the adventure in 2015, at just above 20,000 and nearly 15,000 respectively.

Picture2.jpg
