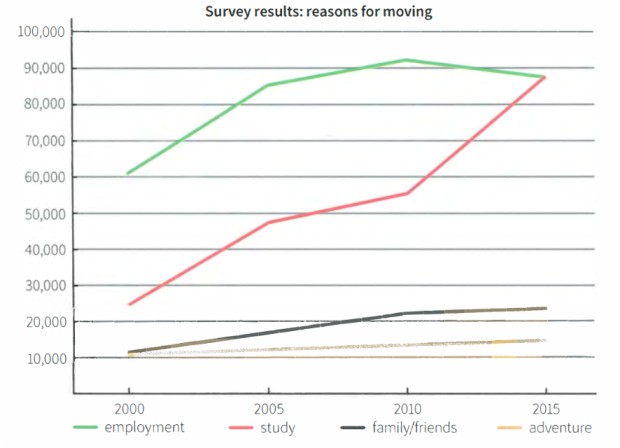
The line chart below shows the results of a survey giving the reasons why people moved to the capital city of a particular country.
Summarize the information by selecting and reporting the main features, and make comparisons where relevant.
The line graph sets out key motivations for the relocation of people to the capital city of a specific country over the period of 15 years from 2000 to 2015.
Overall, educational purpose saw the greatest rise of all four motivations and was by far the most important reason why people moved out along with the employment side. Except for employment, each of all categories witnessed an increase in the answers conducted through the survey.
It can be seen that by 2000, employment was considered to be the main contributing factor for the relocation of people with about 61.000 answers. During the first five years from 2000 to 2005, both studying and working purposes experienced significant changes in the figure. While the study category nearly doubled from about 25.000 to 47.000, the employment side went up to 85.000.
However, since 2010 there was a downward trend in the employment category from 91.000 to 87.000 answers, while relocating for education continued to increase sharply from 47.000 to 87.000 answers. Turning to the family and friends category, from the nearly same starting point with the adventure side at around 12.000 answers, the figure grew considerably during 15 years to 23.000 answers. As regards to moving for adventure purpose, there was a consistent growth in the figure during the same period from 11.000 to 15.000 answers.
Any suggests on how can I improve this essay better? Many thanks!!

Screenshot2024051.jpg
