Question:
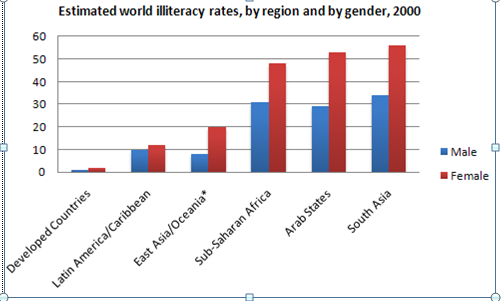
The chart below shows estimated world literacy rates by region and by gender for the year 2000.
_________________________________________________________________ _____
Answer:
There are the chart shows estimated world illiteracy rates by region and gender in the year 2000 between female and male. In general, illiteracy rates in the region South Asia higher than other regions.
Firstly,There are male illiteracy for the 6 areas shown. In the chart, the lowest illiteracy rates were Developed Countries, Latin America/Caribbean, East Asia/Oceania which have percentage each regions as big as 1 %, 10 %, and 8 %. Furthermore, the rates for region Sub-Saharan Africa, Arab States, South Asia have percentage consist of 31 %, 29 %, and 34 %. These three areas were higher than other regions. Secondly, the lowest for female illiteracy rates were again Developed Countries, Latin America/Caribbean, East Asia/Oceania with rates approximately 2 %, 12 %, and 20 %. Then, Sub-Saharan Africa, Arab States, South Asia have percentage namely 48 %, 52 %, and 56 %.
Interestingly there was Developed Countries consists of male and female have illiteracy rates fewest than other regions.
In conclusion, female illiteracy was higher relatively in each areas and male undergo increase slightly in each regions.

illiteracy_rate.png
