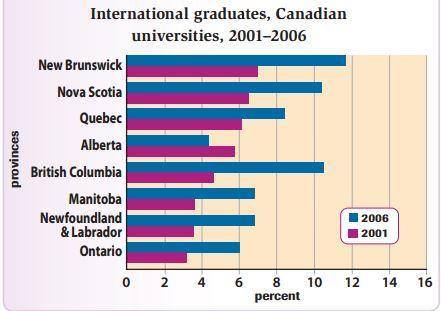
A breakdown of the information about the proportion of international alumni from the third level of education in several Canadian regions between 2001 and 2006 measured by percent was illustrated in the bar chart. Overall, all regions had the highest percentage in 2006, apart from Alberta.
Initially, there were three provinces that had more than 6%. It was followed by Alberta and British Columbia. Although both regions had more than 4%, Alberta was higher than British Columbia. Surprisingly, Manitoba and Newfound Land & Labrador had a similar percentage at 3 %. This was higher than Ontario where had at 2.5%
In 2006, a more detailed looked at the bar reveals that there were only three areas getting more than one out of ten consists of New Brunswick, Nova Scotia, and British Columbia. This was followed by Quebec at around 8%. After that, Manitoba and Newfound Land & Labrador had a similar percent at roughly 7%. Then, Ontario had 6%, while Alberta occupied in the last position at approximately 4%.

chart_3.jpg
