Unanswered [0]
  

Home / Writing Feedback   % width   Posts: 5


IELTS Task 1 - the regularity of eating at fast food places among people in the USA (2003-2013)


emailbr 1 / 3  
Jan 27, 2020   #1

how often americans eat at fast food establishments


Here is my essay

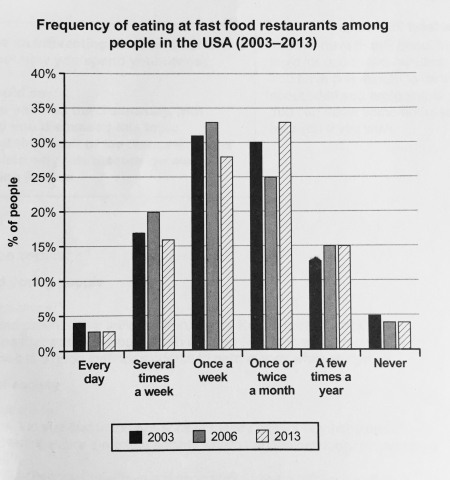
The bar chart illustrates how often USA citizen ate at fast food restaurants from 2003 to 2013. Overall, it can be seen that majority of Americans ate once a week and one to two times a month. Also evident is the fact that only a few people ate at fast food restaurants daily or none at all.

In 2003, the frequency of people eating at fast food establishments weekly and once or twice a month is two third (31% and 30% respectively). The figure increased to about 33% for those who ate weekly while those who fell under once or twice a month category dropped to 25% in 2006. 2013 then experienced a slight fall in once a week category to approximately 27%. In stark contrast, however, more people ate at fast food restaurants once or twice a month in 2013 as seen by the increase to about 33%.

As for the lower proportions, those who ate daily or never ate at all made up under 5% for the whole periods. The several times a week category accounted for about 17% while those who ate a few times a year made up only 15%.

  • 6a0120a5bb05d8970c02.jpg


Rwannajjar 2 / 3  
Jan 27, 2020   #2
Hey
you can use gramamarky to check the grammar mistakes since there are many.
Here something is missing in 2006. 2013 then
Holt  Educational Consultant - / 15512  
Jan 28, 2020   #3
There should only be one trending statement in the report. Your opening summary contains two trending statements. You should only pick one measurement to present at the end of the paragraph. In addition to that, you should have included a summary of the groups being measured. You could have said:

The bar graph contains a listing of the fastfood eating habits of Americans. The measurement covers the specific years of 2003, 2006, and 2013. The indicators used were the convenience meal frequency on a daily, weekly, monthly, and yearly basis. Percentages were used to indicate the number of people surveyed. It appears that the there was an equal percentage of citizens who ate food on the go once a week and once or twice a month.

Try to use a more consistent figure presentation. I do not advise using fractional presentations in a report that has a chart which clearly uses percentage figures. While some will say that changing the presentation of the numbers will show a wide vocabulary, they fail to consider that Task 1 is all about summary accuracy and English comprehension skills. Which is why only the actual data provided should be indicated in the summary. You have to show that you understand exactly what the report says and that you can rephrase everything in a manner that will remain clear to a reader who will most likely not have a copy of the image to compare your report to.
juhuihjijuh 3 / 8  
Jan 28, 2020   #4
Hi dude
Overall, it is not that bad, but some improvements are necessary. Take the given notes into consideration and step forward. Good luck.
OP emailbr 1 / 3  
Feb 2, 2020   #5
@Rwannajjar
Thanks for your suggestion. I will check it out.


Home / Writing Feedback / IELTS Task 1 - the regularity of eating at fast food places among people in the USA (2003-2013)
ⓘ Need Writing or Editing Help?
Fill out one of these forms for professional help:

Best Writing Service:
CustomPapers form ◳

Graduate Writing / Editing:
GraduateWriter form ◳

Excellence in Editing:
Rose Editing ◳

AI-Paper Rewriting:
Robot Rewrite ◳