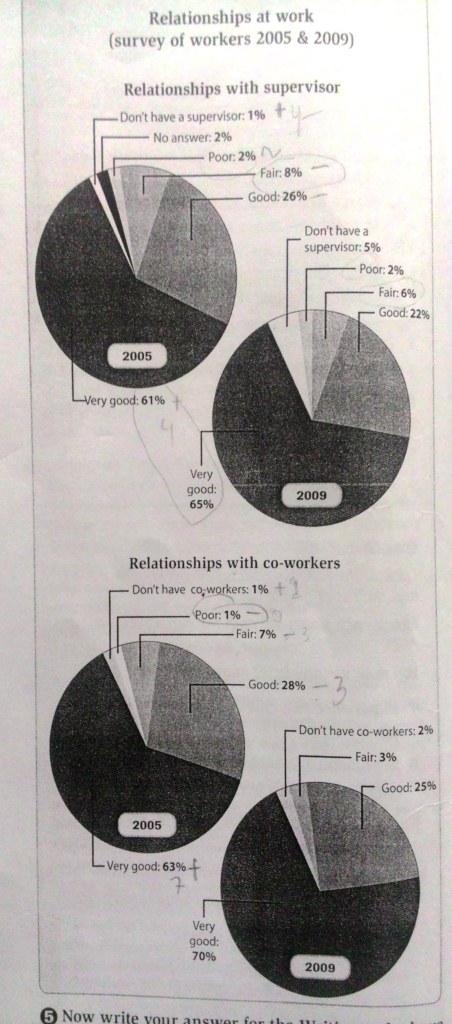
These both pie charts illustrate the percentage of employee relationships. The first chart with the supervisor and the second chart indicates with their co-workers between 2005 and 2009. Overall, it can be seen that the strong bond relation had dominated and on the other hand, poor relationship seen becomes the lowest percentages in both charts over a 4-year period.
To begin, the number of workers whose had very good connection marked increase from 61% to two-thirds over the following years. It was in stark contrast to fair relationship it had only 6% in 2009 or dropped by 2% in the main time frame. While the employees who do not answer the survey disappear in 2009, and in the same time poor relationship leveled off solely at two percent.
Next, between 2005 and 2009, the percentages of very good relationship with co-workers becomes a considerable higher, over than a half. Beside that, it also experienced a steady rose by 7%. Furthermore, people who work alone (did not have co-workers) had a lowest percentage virtually at 2% in 2009, while good relationship took the second highest place in a quarter over the period.

writing_26.jpg
