Unanswered [0]
  

Home / Writing Feedback   % width   Posts: 3


IELTS Task 1: The report, based on graphs, regarding US charity for children


gnahnim 1 / -  
Nov 19, 2020   #1

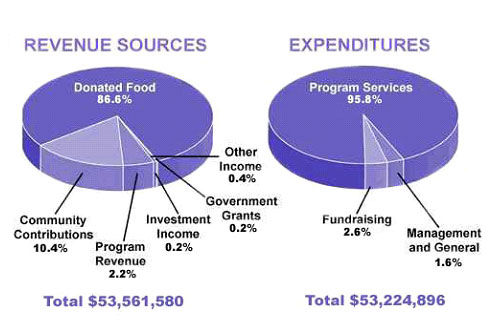
Revenue Sources and Expenditures of a USA Charity in one year.


The pie chart gives information about the revenue sources and the expenditures of the USA children's charity in one year.

As can be seen from the graph, the revenue sources were more than the expenditures of about $336,000, of which, the majority of revenue sources was donated food but program services had a large portion in expenditures.

When it comes to revenue sources, donated food was eighth as much as the community contributions with almost 87% compared to 10.4%. It is clear from the chart that the program revenue had a small fraction with just 2.2%. Investment income and government grants occupied 0,2% each but the other income had a small portion with 0.4%.

As far as expenditures are concerned, a closer look at this pie chart revealed a significant majority with approximately 96%. Fundraising had a small percentage of 2.6%. On the other hand, the minimum expenditures were management and general with just 1.6%.

  • REVENUESOURCESAND.jpg


xkq0802 2 / 8  
Nov 20, 2020   #2
I think you cover all features of the charts. However, it would be better if you could draw certain conclusion or explanation after describing and comparing those 2 charts. Maybe you should pay attention to the use of your tenses as well.
Holt  Educational Consultant - / 15469  
Nov 20, 2020   #3
This is a 3 paragraph report, not a 4 paragraph report. How can you tell the difference? Look at the instructions and the image presented. Then count the number of topics you are expected to present and analyze. In this case you have to:

Par. 1: Create a summary overview + trending statement
Par. 2: Discuss and compare the Revenue Sources
Par. 3: Discuss and compare the expenditures

The summary overview itself is incomplete and does not give an accurate word description of the information provided. There were 2 pie charts ( you identified only 1), The type of measurement used (percentages), The content of each pie chart to be presented, along with the trending statement as the final sentence. This is one reason why the presentation you have given is inaccurate and uninformative to the reader.


Home / Writing Feedback / IELTS Task 1: The report, based on graphs, regarding US charity for children
ⓘ Need Writing or Editing Help?
Fill out one of these forms for professional help:

Best Writing Service:
CustomPapers form ◳

Graduate Writing / Editing:
GraduateWriter form ◳

Excellence in Editing:
Rose Editing ◳

AI-Paper Rewriting:
Robot Rewrite ◳