Unanswered [0]
  

Home / Writing Feedback   % width   Posts: 10


Report of Numeracy Skill in 24 Countries


SHanafi 120 / 357  
Jan 22, 2014   #1
Would you please give correction about my writing.

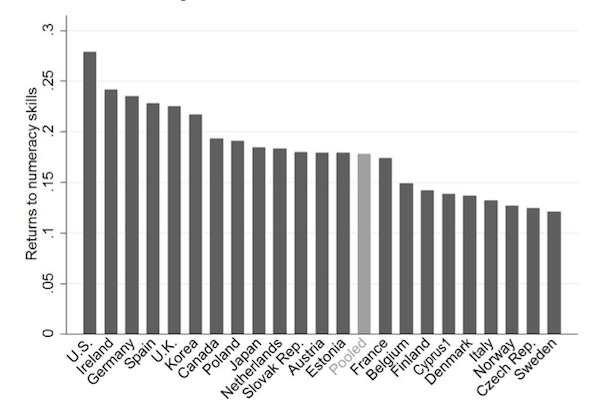
The given pie chart below shows the adult numeracy competencies in 24 different countries.

Overall, the result of numeracy skill was different in each country. According to the data, we can classify them into 3 cluster; lower by 15 point, middle by 15-20, and the over by 2 point. Then, every condition in each group is interesting to see more.

Firstly, the lower groups contain with 8 countries, and dominated by countries from European continent. The motion of numeracy skills in this group is around 15 point to the low of trough point of whole measure.

Secondly, the middle cluster is more fascinating, Japan whom came from Asian continent achieved good numeracy skill for their folk paralleize with other 8 developed countries in Europe. However this is a nice to see while Japan could be compete in the numeracy among developed country in the world.

Lastly, the result survey earn that the highest group with 6 countries have more variety with continents involved. It is United States from America, Ireland-Germany-UK-Spain from Europe, and Korea representative Asia. The topmost expert population in numeracy is attained by US by 2,7 point. Whereas Korea, achieve 2,2 poin and also sign as the only Asian country which stand in the highest cluster.

In the nutshell, whereas based on quantity countries out of Europe are less, their inhabitants strongly enough in numeracy skill, indeed.

  • screen_shot_201401.png


Pahan 1 / 1824  
Jan 22, 2014   #2
The given pie chart below shows the adult numeracy competencies in 24 different countries.

This is not a pie chart. This is a bar chart. You should not have charts mixed up and it is a dangerous thing to happen in this task.

Overall, the result of numeracy skill was different in each country. According to the data, we can classify them into 3 cluster; lower by 15 point, middle by 15-20, and the over by 2 point. Then, every condition in each group is interesting to see more.

The introduction should be followed by an overview. The above paragraph is not a proper overview because the overview should only discuss the main trends and should not include data and details. Once you do the overview, you can proceed to a new part to discuss trends in more detail. There you should use all the statistics and details.
OP SHanafi 120 / 357  
Jan 23, 2014   #3
you're right pahan, this is bar chart :D

so, can i said that in overview, statistical data is unnecesscary ?
dumi 1 / 6793  
Jan 24, 2014   #4
so, can i said that in overview, statistical data is unnecesscary ?

Yes...
OP SHanafi 120 / 357  
Feb 5, 2014   #5
how about making conclusion in writing task I, is there any suggestion ?
dumi 1 / 6793  
Feb 6, 2014   #6
I personally feel this task does not require a conclusion. First, a conclusion is your final judgement or opinion. For the task 2 essay you need to have that because it is based on an argument or issue. However, Task 1 expects a report of your observations without analysis or opinions. On the other hand, an "overview" is a simple description of the main points. It is a summary of the information shown in the graph or chart.

Second, a conclusion should be at the end of a piece of writing. An overview or general summary could go either at the end or near the beginning. Personally, I think it's a good idea to describe the main features of the graph or chart near the beginning of your essay.

Hope the above is helpful :)
OP SHanafi 120 / 357  
Feb 11, 2014   #7
For the task 2 essay you need to have that because it is based on an argument or issue. However, Task 1 asks expects a report of your observations without analysis or opinions. On the other hand, an "overview" is a simple description of the main points.

Hope the above is helpful :)

exactly this very helpful for me Dumi, thank you lots :D
Pahan 1 / 1824  
Feb 11, 2014   #8
how about making conclusion in writing task I, is there any suggestion ?

I personally feel this task does not require a conclusion. First, a conclusion is your final judgement or opinion. For the task 2 essay you need to have that because it is based on an argument or issue. However, Task 1 asks expects a report of your observations without analysis or opinions. On the other hand, an "overview" is a simple description of the main points. It is a summary of the information shown in the graph or chart

I think dumi has given you a very descriptive explanation on the conclusion part. I too agree with here fully because a conclusion is not a requirement for a report on your observations which is the objective of this task. Instead of writing a conclusion, you can have two paras with details (body paras). You need to find some strategy to present information in them. For example, the first detail para can talk about the similarities and the second one the differences.
OP SHanafi 120 / 357  
Feb 12, 2014   #9
talk about the similarities and the second one the differences.

thank you pahan, I should sharper my observation.
eddies [Contributor] 25 / 1170  
Feb 23, 2014   #10
In the nutshell, whereas based on quantity countries out of Europe are less, their inhabitants strongly enough in numeracy skill, indeed.

This is a fragment sentence. You need a main sentence to lead your reader understanding the topic of this paragraph.


Home / Writing Feedback / Report of Numeracy Skill in 24 Countries
ⓘ Need Writing or Editing Help?
Fill out one of these forms for professional help:

Best Writing Service:
CustomPapers form ◳

Graduate Writing / Editing:
GraduateWriter form ◳

Excellence in Editing:
Rose Editing ◳

AI-Paper Rewriting:
Robot Rewrite ◳