TASK 1.
Electricity generation by source in Germany
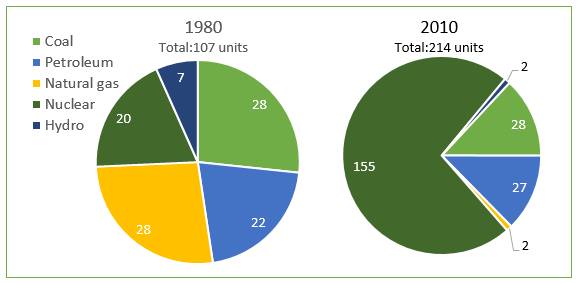
A breakdown of information about electricity production based on its resources in Germany between 1980 and 2010 is revealed in the pie chart. It is measured in units. Overall, it can be seen that, exception petroleum, the usage of other four sources was fairly similar in 1980, while nuclear dominated energy in another period.
There were two resources which had highly changes. By 1980, nuclear energy had 20 units power plant, while there had been a significant increase in the number of electricity production in this power in 2010 at 155 units. In contrast to this, the figure for natural gas, in 1980, stood 28 units, whereas 2010 saw a dramatic decrease in the level of this resource at 2 units.
Turning to coal, petroleum and hydro, these powers were fairly similar trends in both periods. In 1980, natural gas and coal had equal level at 28 units. Then, while the proportion of natural gas declined sharply to 2 units, 2010 witnessed same proportion in the figure for coal. Besides, the number of hydro dropped to 2 units. Astonishingly, the figure for total of these energies inclined twofold from 107 units to 214 units.

944996_1020133978825.jpg
