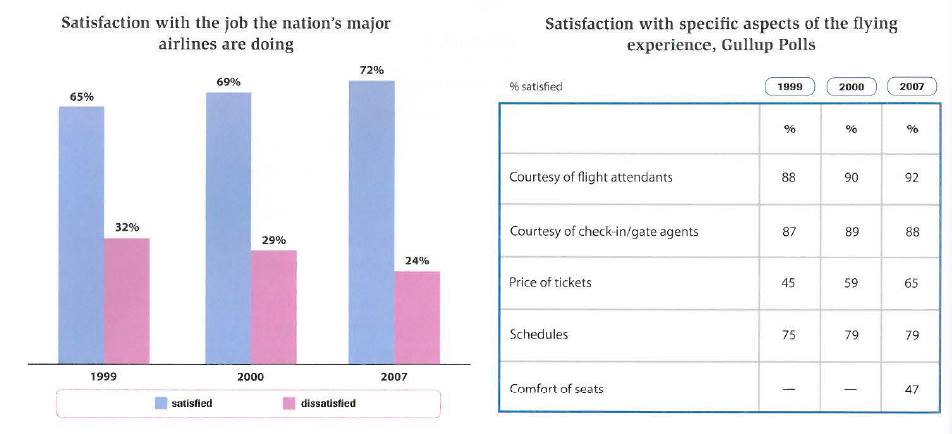
The chart and table below show customer satisfaction levels in the US with airlines and aspects of air travel in 1999, 2000 and 2007.
Both pictures give information about survey results in airlines customer satisfaction levels and passengers' satisfaction for specific of the flying experience. This survey covered United States in 1999, 2000, and 2007. Overall, customers had a high satisfaction for the job the nation's major airlines were doing which was over these years more than a half of all costumers were satisfied. The highest satisfaction aspects were came from courtesy of flight attendants.
The bar chart illustrates passengers who enjoy the airlines and others that feeling bad. From 1999 to 2007, the number of satisfied costumer increased gradually. It was started from 65 percent then grew by 4 percent in 2000 and reached a peak at 72 percent in 2007. Meanwhile, costumers who dissatisfied showed downward trend. There was a slight decreased over those years until in 2007 dropped to 24 percent.
The table shows specific aspects of air travel experience. The biggest percentage satisfaction came from courtesy of flight attendant which hit a high on 92 percent in 2007. The lowest came from comfort of seats, which was just started in 2007 and got 47 percent of passengers' satisfaction. The next aspects are courtesy of check in/gate agent, price of tickets, and schedules which did not have significant improvement between 1999 and 2007.

289343_1_o.png.jpg
