Unanswered [0]
  

Home / Writing Feedback   % width   Posts: 4


The road was by far the most popular of four means of transport; delivery goods by pipeline was rare


jenlisa 1 / -  
Aug 18, 2016   #1
Plese help me to correct my essay. Many thanks.

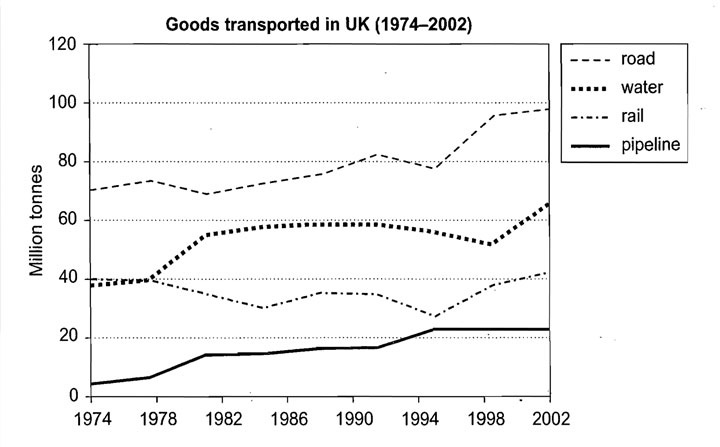
Q: The graph below shows the quantities of goods transported in the UK between 1974 and 2002 by four different modes of transport.

The line graph compares the amount of goods transported in four different types of transportation in the UK over a period of 28 years.

It is clear that the road was by far the most popular of four means of transport over the period shown. It was uncommon to deliver goods by pipeline.

In 1974, around 70 million tonnes of goods was transported by road. Water and rail transportation were used at similar level, stood at around 40 million tonnes, comparison with pipeline was just only 3 million tonnes. In 1995, the amount of goods transported by road, water and pipeline all increased, while the figure for rail transportation fell gradually, reaching the bottom at around 24 million tonnes.

From 1995 to 2002 there was a sudden rise in rail transportation with a jump of over 15 million tonnes, compared to pipeline transportation which remained the same. By 2002, the amount of goods transported by road was highest, peaking at almost 100 million tonnes, and the figure for water also rose to about 65 million tonnes.

  • Cambridge8test4t.jpg


akbarmappiare 31 / 445  
Aug 18, 2016   #2
Hi Jenlisa.
Welcome to Essay Forum.
I have read your writing closely. Actually, this is a good writing grammatically. However, let me help you finalising yours.
Please, you find my footnotes and deal with those.


The line graph compares the amount of goods STUFFS transported in four different types of transportation in the UK over a period of 28 years; FROM 1974 TO 2002(You have to mention the time clearly).

It is clear that the road was by far the most popular of four means ...
OVERALL, IT CAN BE SEEN THAT A DEMAND OF THE ROAD HAD DOMINATED A STATISTICS WHILE THERE HAD BEEN A RESERVE CONDITION IN THE RATE OF THE PIPELINE IN THE TIMELINE. IN ANY CASE, THE FIGURE OF THE WATER HAD SUCCESSFULLY SURPASSED THE POSITION OF THE RAIL.

(You should make your overview more impressive. Tha key of those ways is comparing the figures. If you do it, you are going to achieve the higher score)

Water and rail transportation were used at similar level, stood at ...
INITIALLY, BOTH FIGURES OF THE WATER AND THE RAIL ALMOST TOOK THE SAME PROPORTION AT APPROXIMATELY 40 MILLION TONNES. IN CONTRAST WITH THAT CIRCUMSTANCE, THE LEVEL PIPELINE STATED ONE EIGHTH AS MUCH IN THE SAME YEAR. million tonnes.

Note: You should create the comparison of the figures in each paragraph, so you will achieve the satisfied score in this section. I believe you can master the writing if you wanna practice more and more.

Keep spirit
I am looking forward to reading your writing.
Happy Writing
Faridadwi18 67 / 93  
Aug 18, 2016   #3
Hi Jenlisa,
Here some corrections for you,

- The line graph compares shows the amount of goods transported in four different types of transportation in the UK over a period of 28 years.
You need to make an overview after paraphrase the question. for example : Overall, all of the kind of transportation showed slightly incline trends and the highest amount of goods was by road.

You are good in grouping the graph but you only make few comparative sentences. You can compare the line graph to make your essay more than 150 words. in IELTS task one you need to make an essay with more than 150 words and i think your essay less than 150 words. Hopefully it helps.
justivy03 - / 2265  
Aug 18, 2016   #4
Hi Jenlisa, below are additional suggestions to enhance your analysis.
First of all, when writing, don't forget the minor details such as the linking verbs, the punctuation marks as well as how the sentence is being constructed, this plays a huge role in the overall outcome of the essay.

Furthermore, this analysis is well formulated, accurate to the details presented in the graph, this is critical as you are writing an analysis, it should be the same value stated in the graph and you wrote it in a way that is understandable and your readers can easily comprehend. However, I believe it can still be modified, please find the corrections below;

- It is clear that the road wasis, by far,
- the most popular of the four means
- of transporting goods over the period shown.
- It was uncommon to deliver goods bythrough a pipeline.

- pipeline all increased,

- the amount of goods transported by road wasranked the highest,

There you have it Jenlisa, I hope the above remarks are helpful and even more sio, valuable to your revision.


Home / Writing Feedback / The road was by far the most popular of four means of transport; delivery goods by pipeline was rare
ⓘ Need Writing or Editing Help?
Fill out one of these forms for professional help:

Best Writing Service:
CustomPapers form ◳

Graduate Writing / Editing:
GraduateWriter form ◳

Excellence in Editing:
Rose Editing ◳

AI-Paper Rewriting:
Robot Rewrite ◳