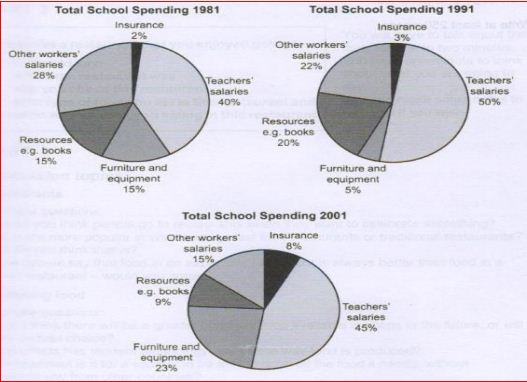
These three pie charts show the changes in annual spending by a particular UK school in 1981, 1991 and 2001.
According to the charts, it can be seen the variability of the annual expenses by a school in the United Kingdom in 1981, 1991, and 2001. Overall, it is apparent from the graph that the total school spending in salaries was the biggest expense from the year given, while the second largest cost was infrastructure such as resources, and furniture and equipment.
Started in 1981, salaries that had been given by school started at 66 percent. In the next decade, the salaries rose significantly to a half of the total school spending for teachers' salaries. But unfortunately, the percentage of other workers' salaries decreased by 4 percent to 22 percent. There was a slight decrease for salaries to 60 percent of school's expenses in the next decade.
Infrastructure such as resources and equipment took the second highest expenditures. Started in 1981, almost one-third school spending had been allocated to this sector. Then, in the next 10-year, there was a slight decrease for infrastructure allocations by 5 percent while the furniture and equipment reach a low point at 5 percent. However, in reverse, the spending for resources bottomed out at 9 percent meanwhile there was a significant increase for furniture and equipment to 23 percent. Insurance had the percentage below 9 percent all the data given.
(215 Words)

289646_1_o.jpg
