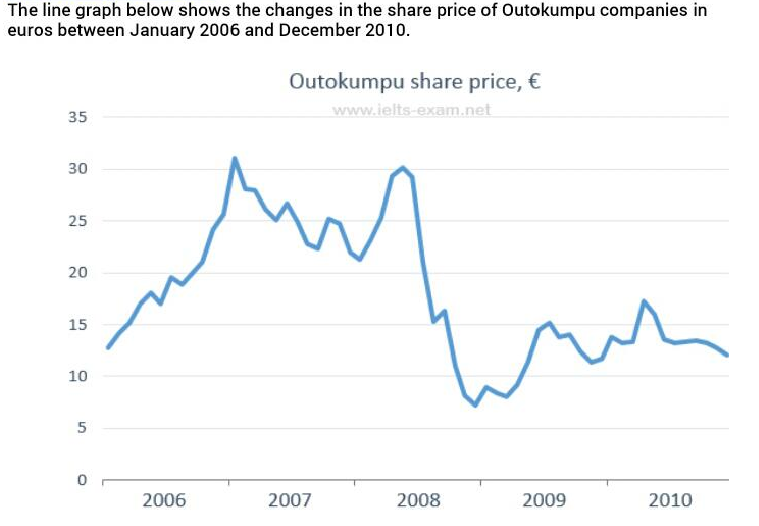
A description of changes in the share price of Outokumpu companies is illustrated by the line graph and is measured in Euros from January 2006 to December 2010. Overall, the aforementioned evidence describes that, despite some fluctuations, there are two peaks time occurred in the beginning and in the middle of the period.
The first half period of the line graph appeared to have a significant rise in the share price in 2006, and then continued to rise dramatically at roughly 30 in early period of 2007. In the following year, 2007 to 2008 saw some fluctuations, after which grew sharply at nearly 30.
Regarding the second half period of the line graph, the share price plunged to a low of approximately 7 in the middle of 2008 and 2009, subsequently jumped up significantly in 2009. Notwithstanding some fluctuations, there was a sharp rise in early 2010, but then a sharp fall occurred in 2010, which led to a slight drop in roughly December 2010.

Graph_3_Picture.PNG
