Hi guys, here is my task 1 essay, please check it for me. Many thanks. :D
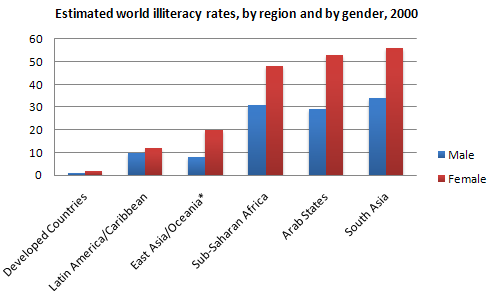
The chart below illustrates the proportion of illiterate men and women in different areas in 2000.
There was a slight difference in percentage of illiterate men and women in the first 3 sectors while the rates in the last 3 sectors experienced a dramatic difference. The rates of illiterate women were always higher than that of men in all regions.
The last three sectors witnessed the very high illiteracy rates and demonstrated the big unevenness in proportion of illiteracy between men and women. Particularly, the highest illiteracy rate of women was recorded in South Asia with 55% which was twofold higher than that of men with 32%. The rates in Arab and Africa were 52% women versus 29% men and 48% women versus 31% men, respectively.
By contrast, the first three sectors had the low percentage of illiterate men and women. While the lowest figure for men and women was approximately the same in Develop Countries with 2%, the rate of illiterate men in East Asia was 9% which is half of women's with about 18%. The illiteracy rate in Latin was 10% male compared to 12% female.
(188 words)

ib_task1_differences.gif
