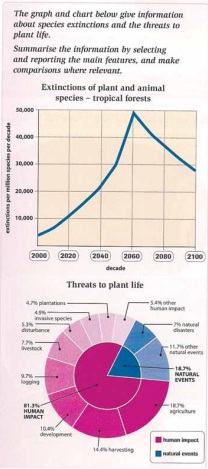
The graph and chart below give information about species extinctions and the threats to plant life. Summarize the information by selecting and reporting the main features, and make comparisons where relevant.
The line graph depicts the in-depth information about endangered plant and animal species in tropical forests, while the pie chart indicates the factors why plant and animal are still extinct. The data is taken from tropical forests in the world during 10 decades, between 2000-2100.
Overall, there were the wide variation causes in the statistic of extinctions plant and animal species with the highest percentage occurring from human impact. Likewise, a hundred years later the number of plant and animal species will be more safety than forty-year before.
First in all, it can be seen that approximately 4.000 in every million species had extinct by 2000. Simultaneously, from 2020 to 2040 onward, this figure is predicted a sharp increase more than three times that of 40-year before. Thus a peak will be achieved in 2060 with 50 million, while the reverse condition will occur between 2080 and 2010, where the number of extinctions of plant and animal species is going on a sharp decrease.
As seen, there are the impact of different types of activity on plant survival. Clearly, over three-quarters of extinctions are caused by human activity, and more than half of this is related in some way to farming. Other activities, such as logging (9.7%) and development (10.4%), also pose threats. Natural events, however, have a quite smaller effect on the lives of plants. Natural disasters, such as tropical storms, account for 7 percent of extinctions, while other natural influences cause a further 11.7 percent.

tropical_forest.jpg
