Number of marriages and divorces in the USA
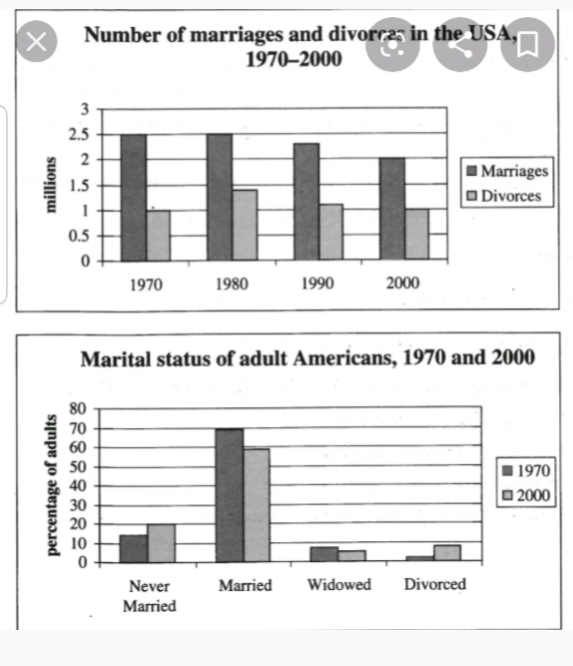
The two bar charts below illustrate the statistics between marriages and divorces rate and marital status of adult Americans ratio from 1970 to 2000.
Overall, the rate of marriages outweighs the divorces within that period of time. Meanwhile, it is crystal clear that the proportions of married Americans is stand at the greatest amount compare to the others' categories.
Having the exact figures, the total quantity of marriage reached the same level between 1970 and 1989,which is occupied 2.5 million. However, begins from 1990, the number tends to dwindle from approximately 2.4 million to 2 million until 2000. At the same time, the trend of divorces is upward from 1970 to 1980,which is from 1 million to roughly 1.4 million. Nevertheless, it decreased slightly from 1980 to 2000.
The second bar chart displays the ratio of marital status of adult Americans. Compared to the married Americans percentage, the others of marital status are strikingly less. It is exceedingly apparent that the least amount is located in 1970 of divorce rate,which is rarely reached 2%.

20191007_141235.jpg
