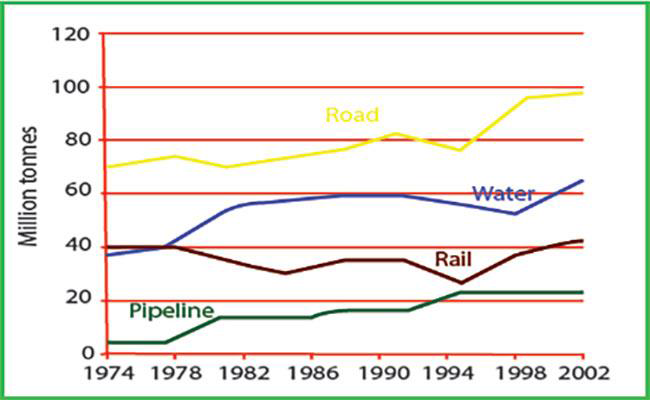
The line graph provides information about four types of transport that delivered things in the UK from 1974 to 2002. Overall, it can be seen that delivered objects by road was the most used while using pipeline was the lowest during the period.
To start with, in 1974 the number of materials transported by road stood at 70 million tonnes. It was followed by using of rail, water, and pipeline in serial. Four years later, using road was a slight increase in almost 80 million tonnes. Then, water and rail reached the same quantity of goods to deliver by 40. However, pipeline was stable at the same number. Between 1982 and 1986, the number of objects was contained by pipeline increased to around 20. Delivering by road and water experienced declining and inclining in serial. However, transporting rail was stable.
Between 1990 and 2002, conveying things used four kinds of transport increased generally. Road was a dramatic incline from 80 to almost 100 million tonnes. Water and rail went up from 60 and just under 40 to 70, and over 40 respectively. Nevertheless, water ever fell to 50 in 1998 and rail to 30 in 1994. Then pipeline experienced stable of goods quantity after reached a peak at over 20 in around 1994. 211w

holiday3.png
