Unanswered [1] | Urgent [0]
  

Home / Writing Feedback   % width   Posts: 2


[Ielts Writing task 1] Summerise information from a graph and table about water consumption


nhaianh2208 1 / 2  
Nov 5, 2020   #1

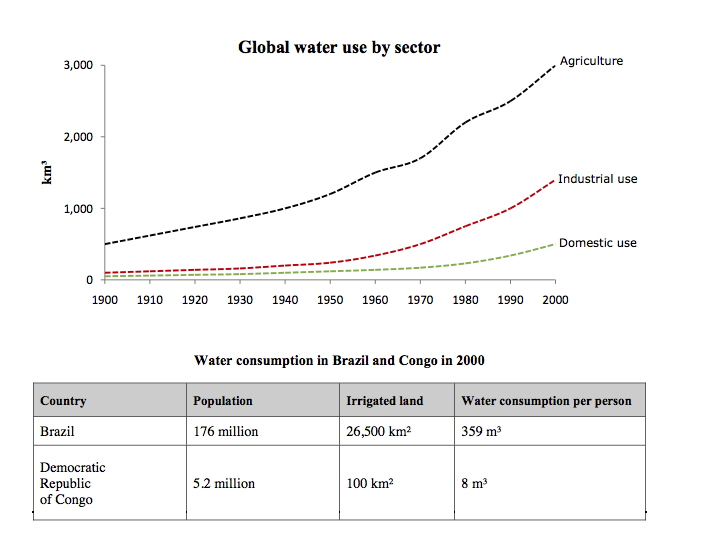
global water use by sector


The given graph illustrates the amount of water used by sector globally each year in the 20th century, while the table compares the water consumption in Brazil and Congo in 2000. Overall, it can be seen that the amount of water used in all 3 sectors worldwide sky-rocketed in this period and the water consumption in Brazil is significantly bigger than in Congo.

To begin with change in global water use in the period of 1900-2000, at first, water was used mainly in agriculture, this sector used approximately 500 km3 of water while these figures of the two other sectors were nearly equal to zero. However, the rising trend was sustained year by year in every sectors. As a result, in 2000, industrial use and domestic use approached the number of 1100 km3 and 200 km3 respectively. Agriculture remained the major-used sector and consumed more than 3000 km3 of water at the end of the 20th century.

Secondly, the consumption of water was not only totally different among sectors but also among countries. This difference may be brought about due to the irrigation system in each country. As we can see from the table, the area to construct irrgation system in Brazil in 2000 was about 26,500 km2, which was 265 times bigger than in Congo. Consequently, the water consumption per person was nearly 360 m3 while this number of Congo was only 8m3.

Note: I am studying Ielts for the first time of my life so I may have many mistakes in my essay. Therefore, if you dont mind, it would be better for my practice when you give me a mark. Finally, I sincerely thank you for your attention and help!

  • the graph and table


Holt  Educational Consultant - / 15384  
Nov 6, 2020   #2
I can review your essay and offer you useful advice. As for marking your essay, you will need to subscribe to our private review service or upgrade this posting to an URGENT thread. That is because scoring / marking essays are no longer part of our free review services. That also means that any student who scores your essay will find his account automatically suspended for forum rule violations.

The task 1 essay only allots 20 minutes for its complete writing and editing. In word count, that is converted into 150-190 words. You wrote 234 words, which is almost enough for a task 2 essay. Time yourself next time. Do your best to draft, edit, and finalize your content within 20 minutes. As a beginner, you may find it difficult to do so.

Try to limit your writing to the appropriate word count. Over writing and over analyzing the essay will not work to your benefit. Keep it simple, just relate the data directly. That way you will leave enough time for you to double check your work, find your errors, correct them, and hopefully, get yourself a passing score. Right now, You really need to focus on writing less, while still keeping your presentation informative and understandable to the reader.


Home / Writing Feedback / [Ielts Writing task 1] Summerise information from a graph and table about water consumption
Do You Need
Academic Writing
or Editing Help?
Fill out one of these forms:

Graduate Writing / Editing:
GraduateWriter form ◳

Best Essay Service:
CustomPapers form ◳

Excellence in Editing:
Rose Editing ◳

AI-Paper Rewriting:
Robot Rewrite ◳

Academic AI Writer:
Custom AI Writer ◳