Unanswered [1] | Urgent [0]
  

Home / Writing Feedback   % width   Posts: 2


Ielts Writing Task 1: The supplied line graph indicates the consumption of beef, lamb and fish


Tommy Jasper 1 / -  
Feb 9, 2023   #1

the consumption of fish and some different kinds of meat


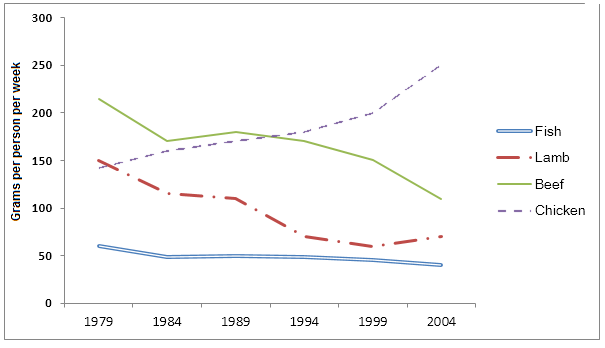
The supplied line graph indicates the consumption of fish and some different kinds of meat, namely beef, lamb and fish of a nation which is located in Europe from 1979 to 2004.

Overall, whereas the consumption of beef, lamb and meat decreased, that of chicken went up. Besides, it can be clarified that fish was consumed the least, but the consumption of chicken taken the lead.

The amount of chicken was consumed started at 140 grams each week at the beginning of 1979. Afterwards, there was a rise of 180 grams during 1989. Moreover, the year of 1994 witnessed a sharp upward trend in how much chicken was eaten, approximately 225 grams on a weekly basis. Over a period of 10 years from 1994 to 2004, that of chicken continued to rise to 250 gram.

In terms of the consumption of beef, it fell slightly from 220 grams (1989). Besides, there was a similar trend in two categories left, namely lamb and fish. Both of them went down from 150 grams in 1979 to 120 grams weekly in 1989 with lamb and from 60 grams during 1979 to about 47 grams in 1989 with fish. After that, the amount of fish consumed stayed remain over a period of ten years between 1994 and 2004. Yet, that of beef and lamb plunged continuously at about 180 grams to 125 grams and 70 grams to 60 grams, respectively.

  • consumptionfishmea.png


Holt  Educational Consultant - / 15342  
Feb 10, 2023   #2
Make it a practice to use at least 2 sentences for your summary overview. This will help create a more comprehensive information presentation since each sentence will have a single information focus. Combining all of the information in one sentence tends to create a confusing presentation as the reader cannot keep track of what you are actually trying to inform him about. By the way, it would be better if you can present the connected year references in terms of decades or centuries. You see, doing so would add to your LR score since you will be using advances vocabulary like decades and half century as reference points.

Work on your sentence structure in relation to time frame references. You have a tendency to mix up past and present reference points in your sentences. It creates a grammatically incorrect and confusing sentence idea for the reader. While I can see the effort that you put into the development of the presentation, your weak English language skills are what caused the failing GRA and C+C scores. Develop your English language skills in these regards to improve your paragraph presentations.

Since there are several references for the report, you should have a proper partnering of information to help increase the quality of information presentation per paragraph. Limiting the discussion to pairs or proper grouping would allow you to create the correct comparison analysis from the chart data. For example, you could have done Fish and Lamb, Beef and Chicken, within 2 comparison paragraphs. It would have created a more understandable comparison discussion.


Home / Writing Feedback / Ielts Writing Task 1: The supplied line graph indicates the consumption of beef, lamb and fish
Do You Need
Academic Writing
or Editing Help?
Need professional help with your assignments? Fill out one of these forms:

Graduate Writing / Editing:
GraduateWriter form ◳

Best Essay Service:
CustomPapers form ◳

Excellence in Editing:
Rose Editing ◳

AI-Paper Rewriting:
Robot Rewrite ◳