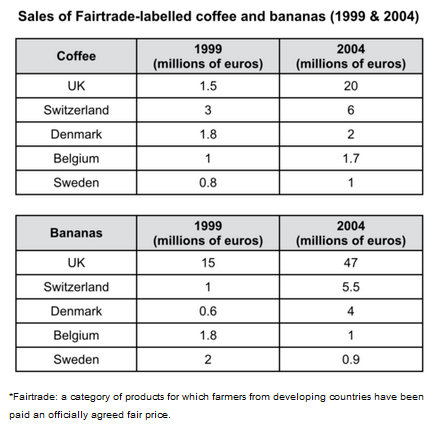
The tables below give information about sales of Fairtrade*-labelled coffee and banana in 1999 and 2004 in five European countries.
Summarise the information by selecting and reporting the main features, and make comparisons where relevant.
A breakdown of two fairtrade-labbelled products in several European countries are depicted in the tables. The data is collected in two different years (1999 and 2004). Overall, it is noticeable that, while Switzerland shared a significant proportion for coffee with United Kingdom, it was the highest cohort for bananas in both of periods.
Regarding to coffee commodity, there was an upward trend in the amount of commerce in each country. In 1999, the greatest proportion was 3mn in Switzerland and it increased twice five years later. While UK and Denmark began at extremely closed point, at 1,5mn and 1,8mn respectively, UK overtook others with an increase by 19,5mn in 2004. Besides that , Belgium and Sweden experienced a very small number, roughly 1mn sales over a 5-year period.
Turning to the figure for banana, Switzerland started at 15m, which is the highest number in the beginning, and it was still popular in 2004, at 47mn sales. UK and Belgium saw a similar pattern, from 1mn and 0,6mn initially to jump six time at the end of period. On the other hand, the rest of groups had less sales in 1999 than 2004.

Fairtrade.png
