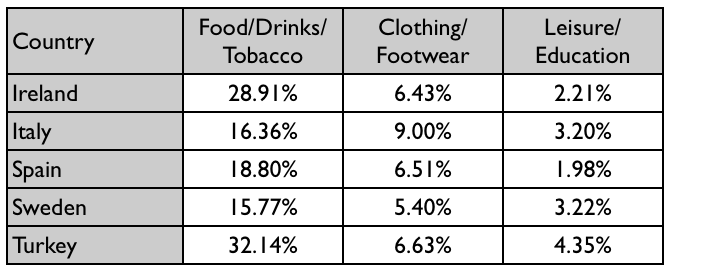
The table below gives information on consumer spending on different items in five different countries in 2002.
The table compares the percentages of product consumption among five different countries in Europe in 2002. The statistics are divided into three groups based on item types.
According to the figures, the greatest expense rose in food, drinks and tobacco. For instance, Turks and Irishs had considerable proportions of their disposable incomes spent on these goods, namely 32.14% and 28.91%. By contrast, the amount of money put forward to purchase leisure and educational products was only a tiny fraction of all sorts, ranging between 2-4%. Once again, Turkey hold the highest spending (4.35% of total budget).
In terms of expenditure on clothing and footware, Italians appeared to get more enjoyment buying fashion items than the rest, with 9% of expense incurred in those goods.
To sum up, the table shows that there was some significant discrepancy between spending habits of people in five countries for various lifestyle needs.
(174 words)
Please give me some feedback on this essay :D Thank you very much

