Here is my writing in IELTS, finally I got 5.5. Is there anybody help me to correct it and tell me why my score is so low? Feel free to give me your suggestions! I will be appreciated very much!
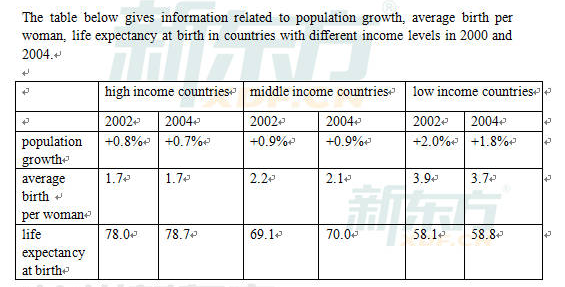
The table below gives information related to population growth, average birth per woman, life expectancy at birth in countries with different income levels in 2000 and 2004
Given in the table describes how the population growth, average birth each woman, life expectancy at birth changed from the period of 2000 and 2004 in countries of three different levels, that is, high level, middle level and low level.
According to the population growth, there were a slight drop happened in the high income countries and low income countries in the year of 2002 and 2004, with from 0.8% to 0.7% and 2.0% to 1.8 respectively, while the middle class countries stay at the same level, at 0.9%.
Moving on to the average birth each woman, the period from 2002 to 2004 saw a gradual decrease in the middle income countries and low income countries, which is 2.2 to 2.1 and 3.9 to 3.7 respectively. The high income countries was stable at 1.7 in the year of 2002 and 2004.
Regarding to the life expectancy at birth, there was a small rise happened among all the countries, with an increase at 0.7 to 0.8.

.png
